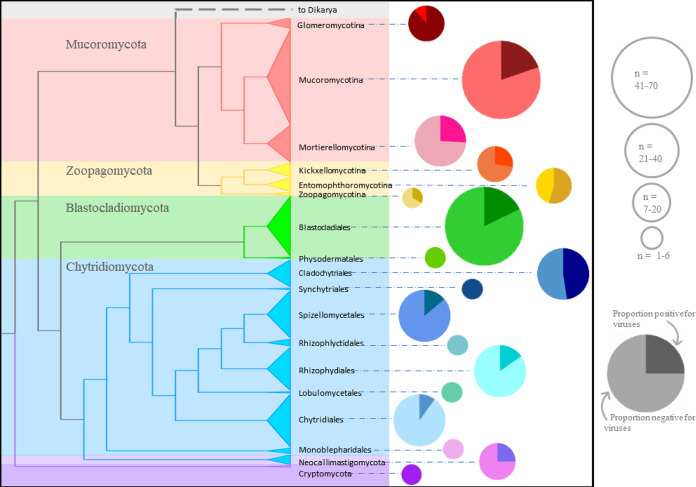
FIG 3.
Cladogram of the organisms screened for viruses by both methods in this study. The size of the collapsed clades is proportional to the number of isolates screened. Pie charts indicate the proportions of isolates in each taxon that were viral positive (darker shade); pie charts are sized according to number of isolates screened. Whole pies had a 0% infection rate.

