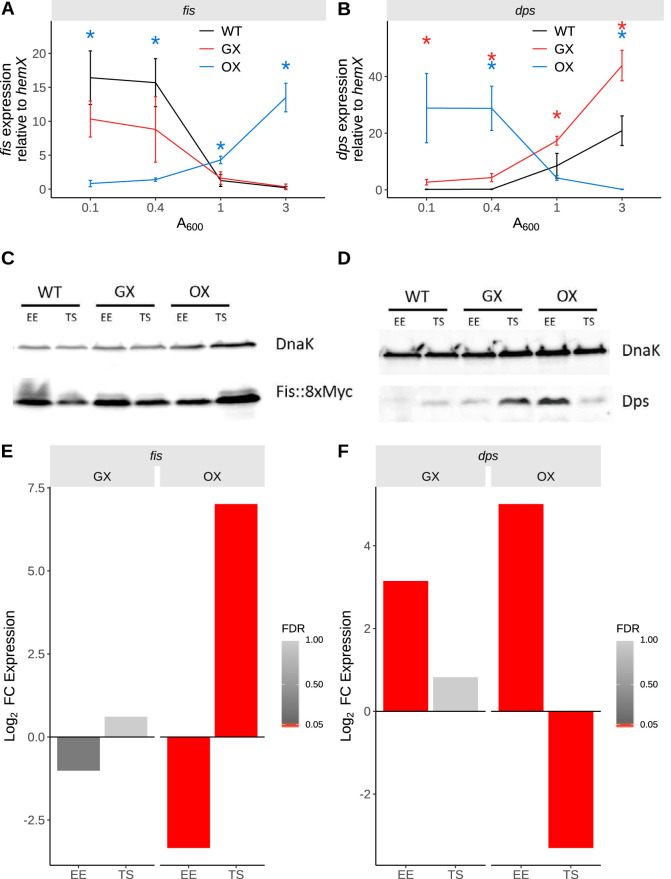
FIG 2.
Gene expression changes. (A) Expression of fis transcript during the course of the growth curve assayed using RT-qPCR. Significance was determined relative to the wild type using Welch's t test, and P values were adjusted using the BH method. Adjusted P values are indicated with asterisks (*, P < 0.05; **, P < 0.01; ***, P < 0.001; ****, P < 0.0001). Black, WT; red, GX; blue, OX. (B) Expression of dps transcript during the growth curve. Black, WT; red, GX; blue, OX. (C) Fis protein levels determined by immunoblotting with anti-Fis monoclonal antibody. (D) Dps protein levels determined by immunoblotting with anti-Dps polyclonal serum. (E and F) Expression changes in fis and dps genes determined by RNA-seq in the GX and OX strains at the EE and TS phases of growth. The color bar indicates FDR, and bars representing genes with FDR values of <0.05 are red.

