FIG 4.
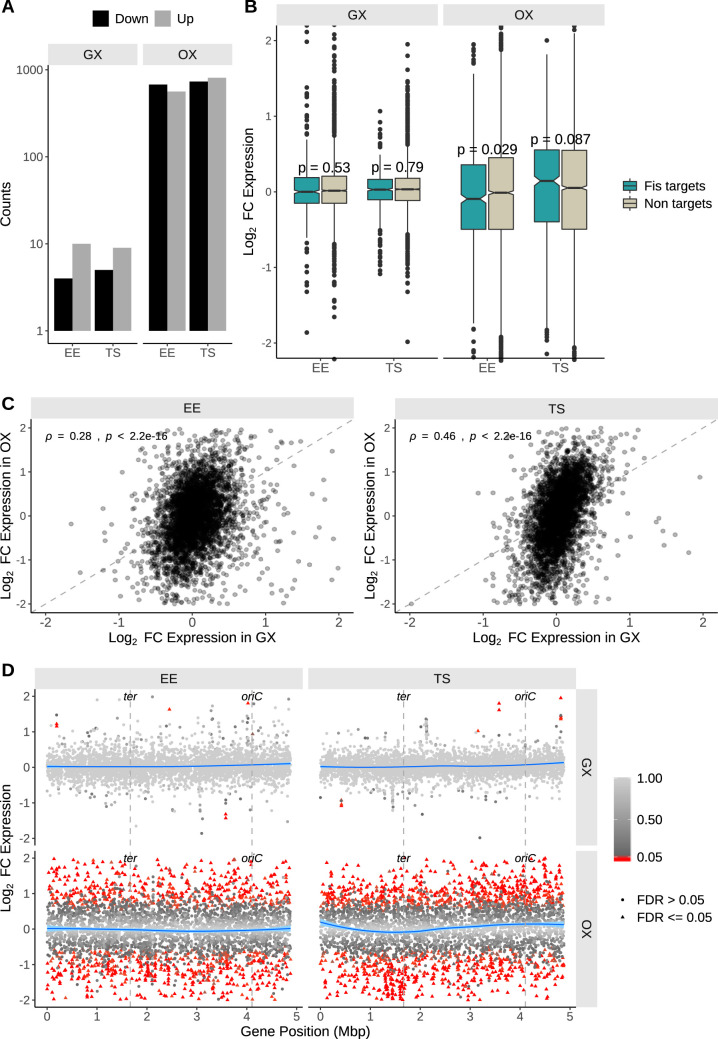
Transcriptomic changes assayed by RNA-seq. (A) Counts of differentially expressed genes. (B) Box plot distribution representations of Log2 fold change in expression of genes in the GX and OX strains. The genes have been split into two groups based on whether or not they are predicted to be Fis targets. P values obtained using the two-sample Wilcoxon test for the comparison between Fis targets and nontargets are indicated over each pair of box plots. (C) Spearman’s correlation of Log2 fold changes in expression of genes in the GX with the OX strain. The dashed line has a slope of 1 and indicates the position where the fold changes are equal. (D) Log2 fold change in expression of genes along their position on the chromosome in millions of base pairs. The blue curve shows the local regression peak intensity change calculated using the R LOESS function. Significant gene expression changes (FDR < 0.05) are shown as red filled triangles.

