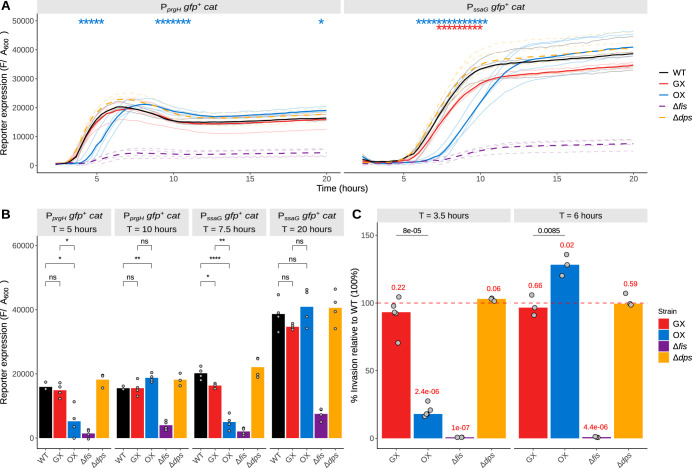
FIG 5.
Pathogenicity island expression changes assayed using chromosomal Pgfp+ reporters. (A) SPI-1 expression corresponding to the PprgH gfp+ chromosomal fusions and SPI-2 expression corresponding to the PssaG gfp+ chromosomal fusions are reported. Reporter expression is measured by determining the fluorescence (F) of gfp+ expression divided by A600. Means of results from biological replicates are shown as solid lines, and data from the individual biological replicates are shown in the background as lines with lighter shading. Significance was determined relative to the wild type using Welch's t test, and P values were adjusted using the BH method. Adjusted P values (WT versus GX and WT versus OX comparisons only) are indicated with asterisks (*, P < 0.05). (B) A slice of the data in panel A showing reporter expression at early time points (SPI-1, 5 h; SPI-2, 15 h) versus later time points (SPI-1, 15 h; SPI-2, 20 h). Bars represent median values, and the individual biological replicates are represented by the scatter. ns, not significant; *, P < 0.05; **, P < 0.01; ***, P < 0.001; ****, P < 0.0001. (C) Results of epithelial cell invasion assay carried out with subcultures grown to two different time points (early, 3.5 h; late, 6 h). Plotted are percent invasions of the strains relative to the WT (100% [not shown], depicted by the red dashed line) in HeLa cells determined 90 min postinfection. Median values of percent invasion are represented by the bars, and values from biological replicates are represented by the scatter. P values obtained from one-sample t tests (μ = 100) are shown in red above each strain designation. P values obtained from Welch’s two-sample t tests between GX and OX are indicated over these comparisons in black.

