Figure 2.
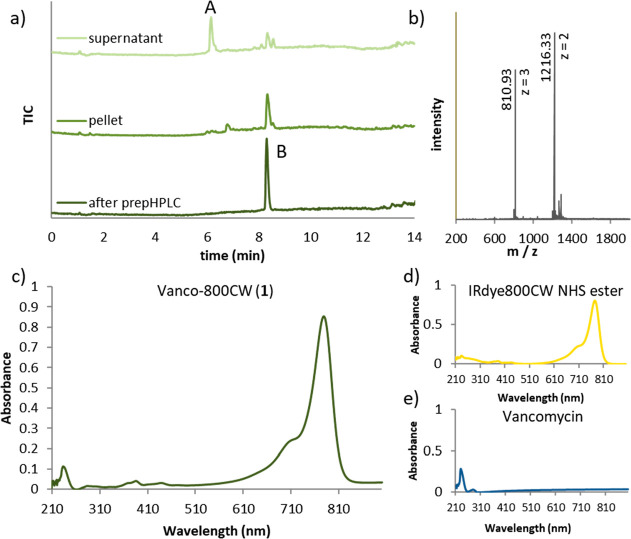
Analytical data for the synthesis and evaluation of Vanco-800CW (1). (a) UPLC-MS traces (TIC), collected after addition of water to the reaction mixture, of the supernatant (top), pellet (middle), and HPLC-purified product (bottom). Peak A corresponds to vancomycin, and peak B corresponds to Vanco-800CW. (b) Mass spectrum corresponding to Vanco-800CW (compound 1, peak B from panel a). (c) UV–vis absorption spectra for Vanco-800CW (1), (d) IRdye800CW NHS ester, and (e) vancomycin hydrochloride (2.8 μM, 1% DMSO in water). In panel (c), distinct bands at λmax = 776 and 232 nm are observed, which are also present in the spectrum of IRdye800CW NHS ester (λmax = 776 nm, spectrum d) and vancomycin (λmax = 232 nm, spectrum e).

