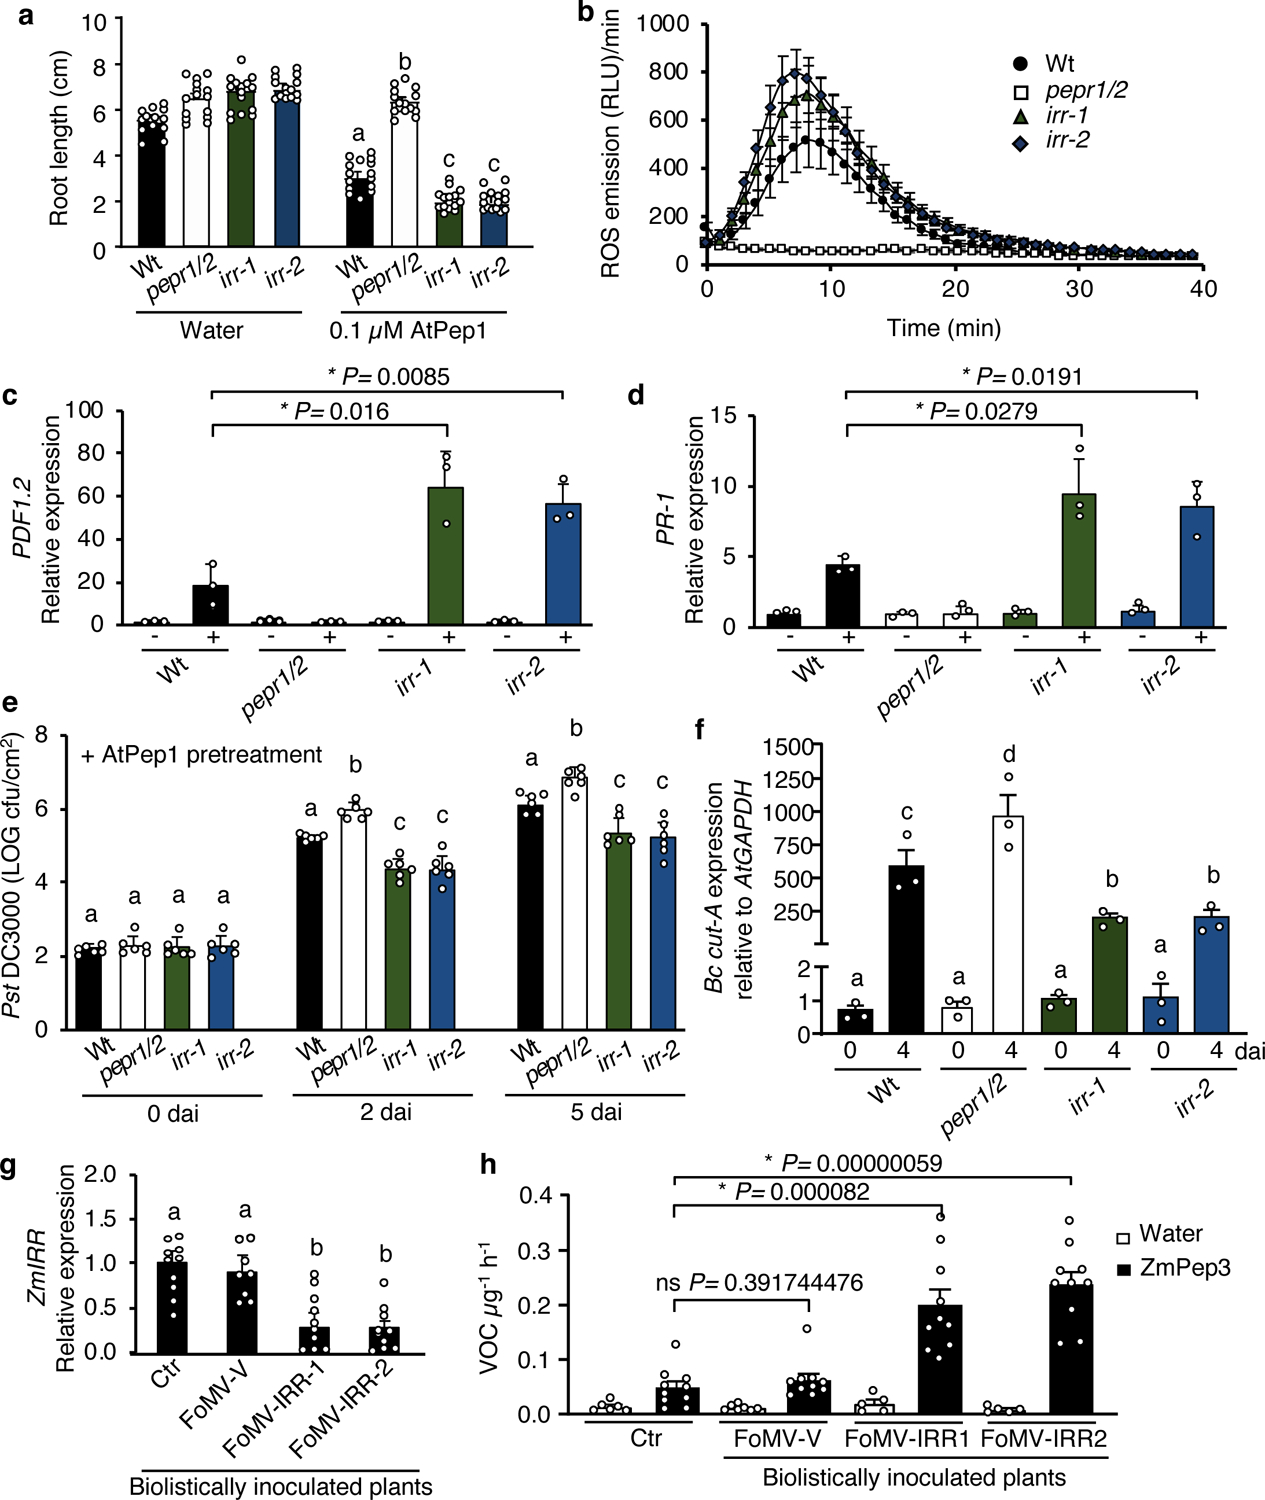
Figure 2. IRR mutants are hypersensitive to AtPep1 treatment.

a, Arabidopsis seedlings were treated with water or a solution of 0.1 μM AtPep1, and root length measured after 15 days of treatment. Values represent the mean ± SD of 15 seedlings. b, Total ROS production was registered continuously using luminol fluorescence for 40 min after addition of 0 or 1 μM AtPep1, then summed. The values are the mean ± SEM. c, The relative expression level of AtPep1-inducible genes PDF1.2 and PR-1 (d) was determined by real-time qRT-PCR using mRNA from entire seedlings treated with water (−) and a solution of 1 μM AtPep1 (+) for 24 hours. Values represent the fold-change in expression versus the water-treated wild-type (Wt) samples after normalization against GAPDH expression. Error bars indicate the SD of three biological replicates. e, Pst DC3000 infection assay of wild-type (Wt), pepr1/pepr2 (pepr1/2), irr-1 and irr-2 plants after pretreatment via infiltration with a solution of 1 μM AtPep1 24 hours prior to infection. Bars indicate samples immediately following inoculation (0), or 2 and 5 days after inoculation (dai). Error bars indicate SD, n = 6. f, Botrytis cinerea infection in wild-type, pepr1/pepr2 and irr mutants. Quantification of in planta growth of B. cinerea. qPCR was used to analyze the relative level of B. cinerea Cutinase A genomic DNA (Bc cut-A) compared with Arabidopsis GAPDH (Bc cut-A/AtGAPDH). Error bars indicate SD, n = 15. Experiments in a–f were repeated at least three times independently, with similar results. g, Analysis of ZmIRR gene expression in maize plants carrying Foxtail Mosaic Virus-based viral-induced gene silencing constructs targeting ZmIRR (FoMV-IRR-1 and FoMV-IRR-2) relative to empty viral vectors (FoMV-V) or uninoculated control plants (Ctr). The bar graphs display the relative expression levels of ZmIRR mRNA in leaf 5 as determined by real-time qRT-PCR. Values represent the fold-change in expression versus the uninoculated control (Ctr) samples after normalization against ZmRPL17 expression. h, Total volatile organic compounds (VOCs) from maize leaves inoculated with viral-induced gene silencing constructs targeting ZmIRR (FoMV-IRR-1 and FoMV-IRR-2) relative to empty viral vectors (FoMV-V) or uninoculated control plants (Ctr). VOC were measured 16 hours posttreatment with water or with a 5 μM solution of ZmPep3. All error bars indicate the SD of 5–10 biological samples. Experiments in g and h were repeated two times independently, with similar results. For all graphs, different letters represent significant differences (one-way ANOVA followed by Tukey’s test corrections for multiple comparisons; P < 0.05). The asterisk indicates significant differences using Student t-tests (two-tailed distribution, unpaired), with P < 0.05; ns, not significant.
