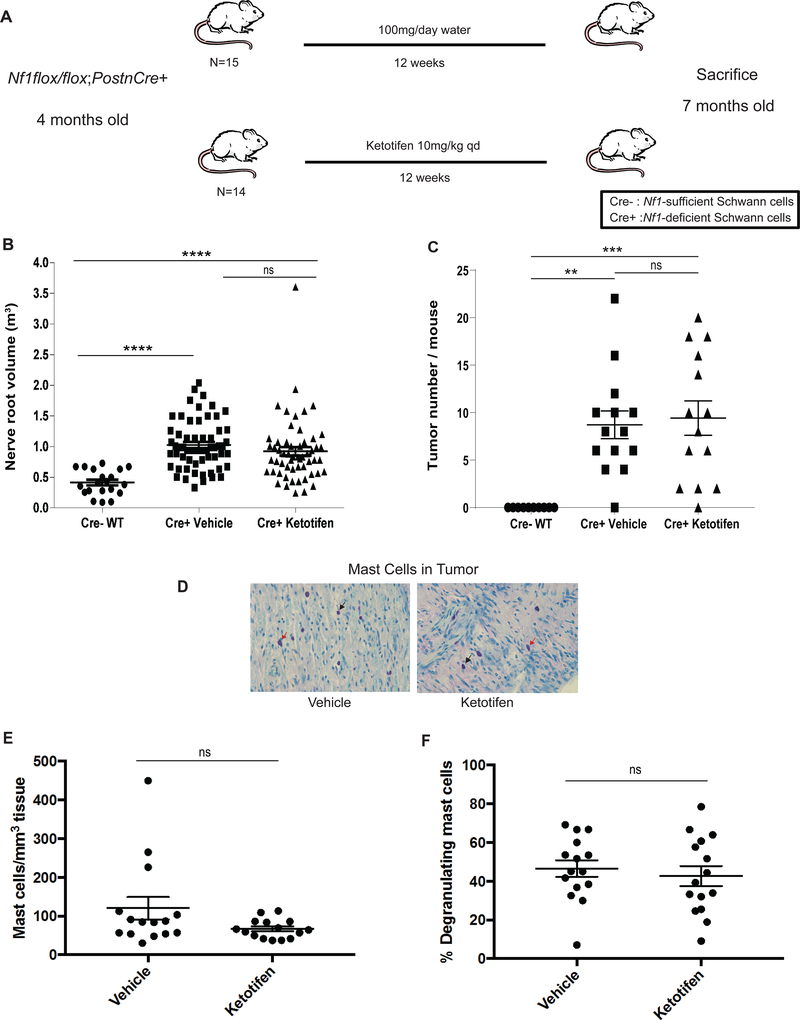
Figure 2. Ketotifen Fails to Inhibit Established Neurofibroma Progression in Nf1-deficient Mice.
(A) Schematic of experimental design of established tumor regression study. (B) Proximal nerve root volume in water/vehicle and ketotifen-treated Nf1flox/flox;PostnCre+ mice (P > 0.05, ns) and in WT Nf1flox/flox;PostnCre- mice (water/vehicle-treated vs WT P < 0.0001****; ketotifen-treated vs. WT P < 0.0001****). (C) Quantitation of tumors in water/vehicle and ketotifen-treated Nf1flox/flox;PostnCre+ mice (P > 0.05, ns) and in WT Nf1flox/flox;PostnCre- mice (water/vehicle-treated vs WT P = 0.0010**; ketotifen-treated vs. WT P = 0.0004***). (D) Histological analysis of toluidine blue-stained tumor tissue from water/vehicle- and ketotifen-treated Nf1flox/flox;PostnCre+ mice. Images were obtained using a 40X objective lens. Black arrows point to representative infiltrating mast cells. Red arrows point to representative degranulating mast cells. (E) Quantitation of mast cell infiltration in water/vehicle- and ketotifen-treated Nf1flox/flox;PostnCre+ mice (P = 0.0821, ns). (F) Quantitation of the percentage of degranulating mast cells in water/vehicle and ketotifen-treated Nf1flox/flox;PostnCre+ mice (P = 0.5686, ns).

