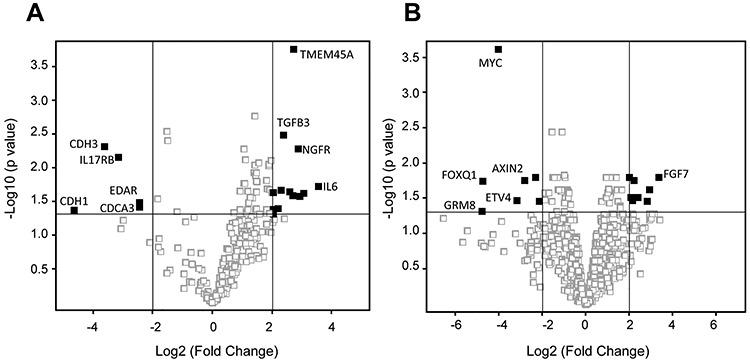
Fig. 1.

Immune response-associated gene and SCC820 cancer-associated gene expression profiling in CRT-treated rectal cancers. Upregulated or downregulated immune response-associated genes (A) and SCC820 cancer-associated genes (B) with changes >4-fold identified using a volcano plot with Benjamini–Hochberg correction. The horizontal grey line represents a P value of 0.05. The vertical gray lines show 4- and 0.25-fold changes in gene expression. The closed squares represent the upregulated and downregulated genes with changes >4-fold, respectively.
