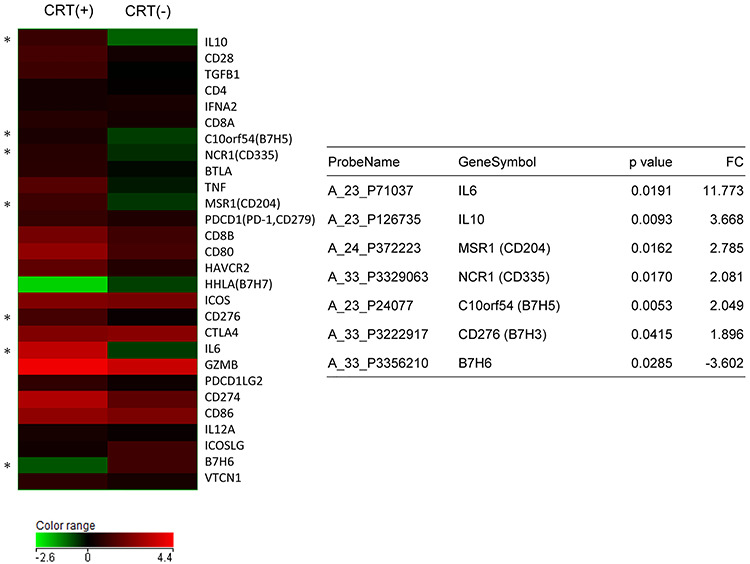
Fig. 4.

B7 Family and cytokine gene expression profiling in CRT-treated rectal cancers. The relative expression ratio of each tumor tissue versus surrounding normal tissue was calculated from normalized values. The color log scale indicates the average of each group. Genes with significantly altered expression between CRT-treated (6 cases) and not-treated (8 cases) rectal cancers were selected. *P < 0.05, statistically significant. A summary of the statistical analysis is shown in the table.
