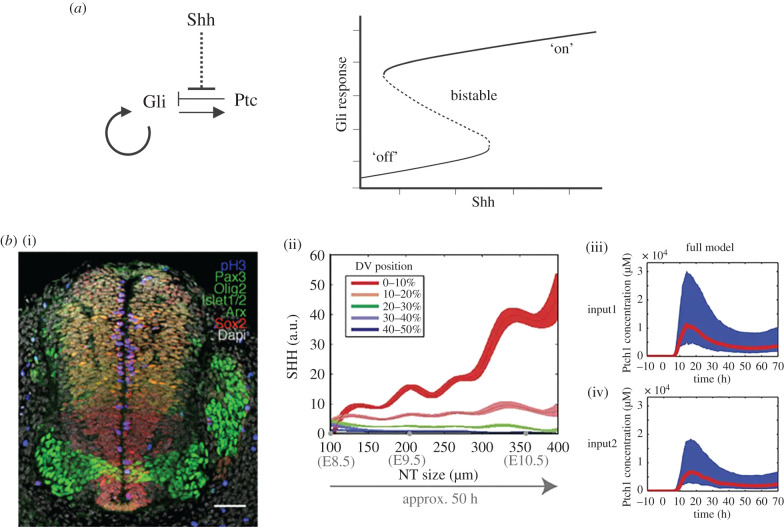
Figure 2.
Modelling Shh-controlled gene expression. (a) (i) Key feedbacks present in the model in [66]. (ii) Bifurcation analysis of the model in [66]. The model exhibits bistability, demonstrating that a graded input of Shh can result in a binary response. (b) (i) Example of transverse section of the developing neural tube, molecularly labelled for genes that indicate DV identity, from [67]. (ii) Experimental measurements of Shh levels from [68]. (iii, iv) Fitting of the data to the mathematical model in [68], with high (upper) and low (lower) expression of Shh. a.u., arbitrary units.

