
Figure 15.
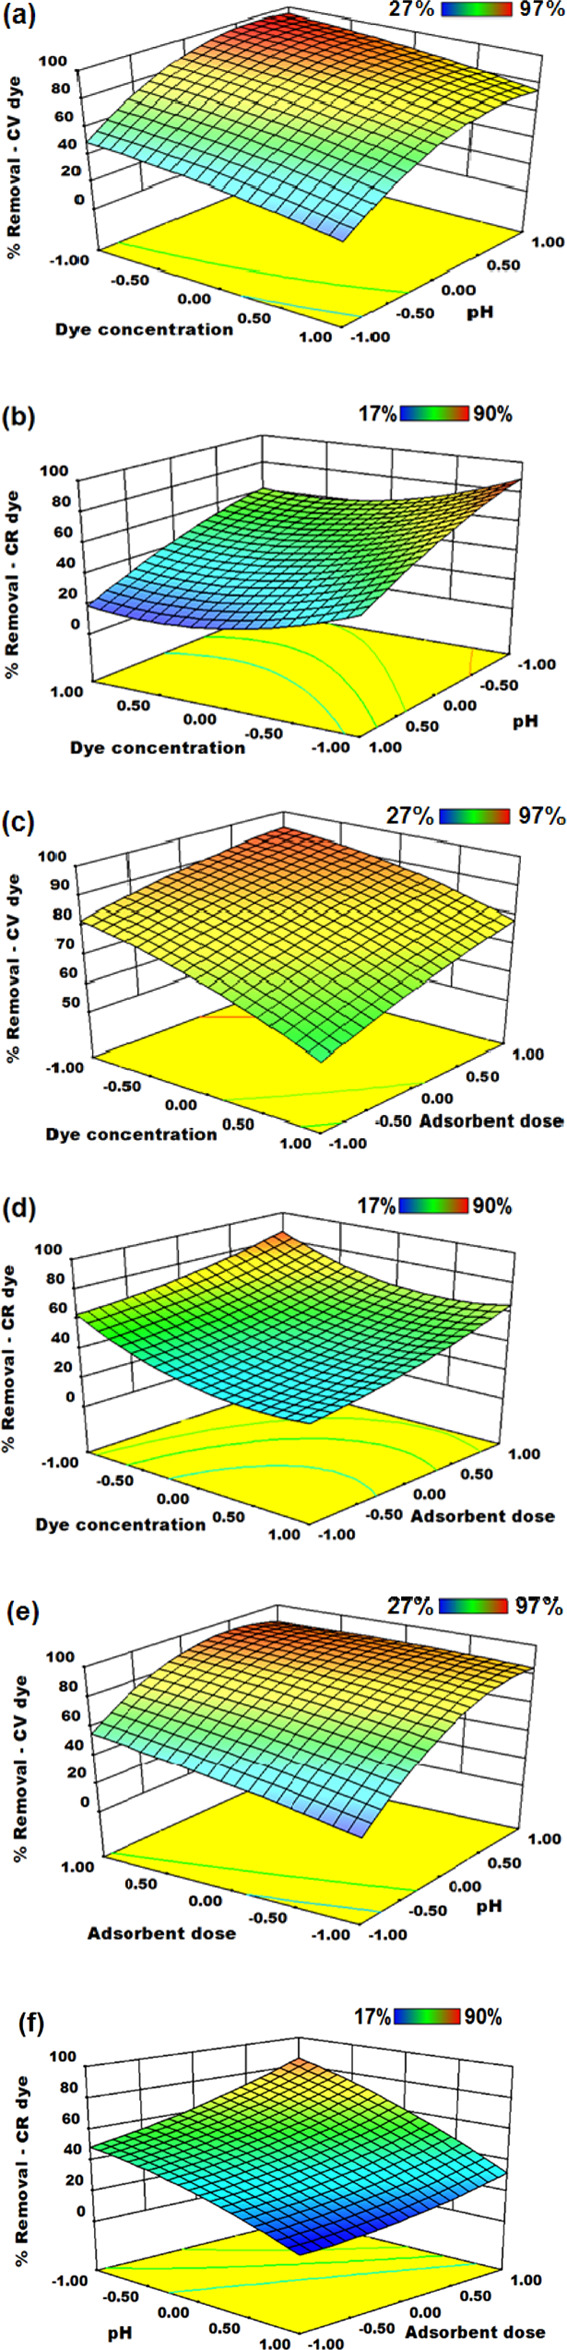
3D surface plots illustrating binary combined effects of input variables on the dye decoloration percentage: (a) dye concentration and pH (CV); (b) dye concentration and pH (CR); (c) dye concentration and CDA dose (CV); (d) dye concentration and CDA dose (CR); (e) pH and CDA dose (CV) and (f) pH and CDA dose (CR).