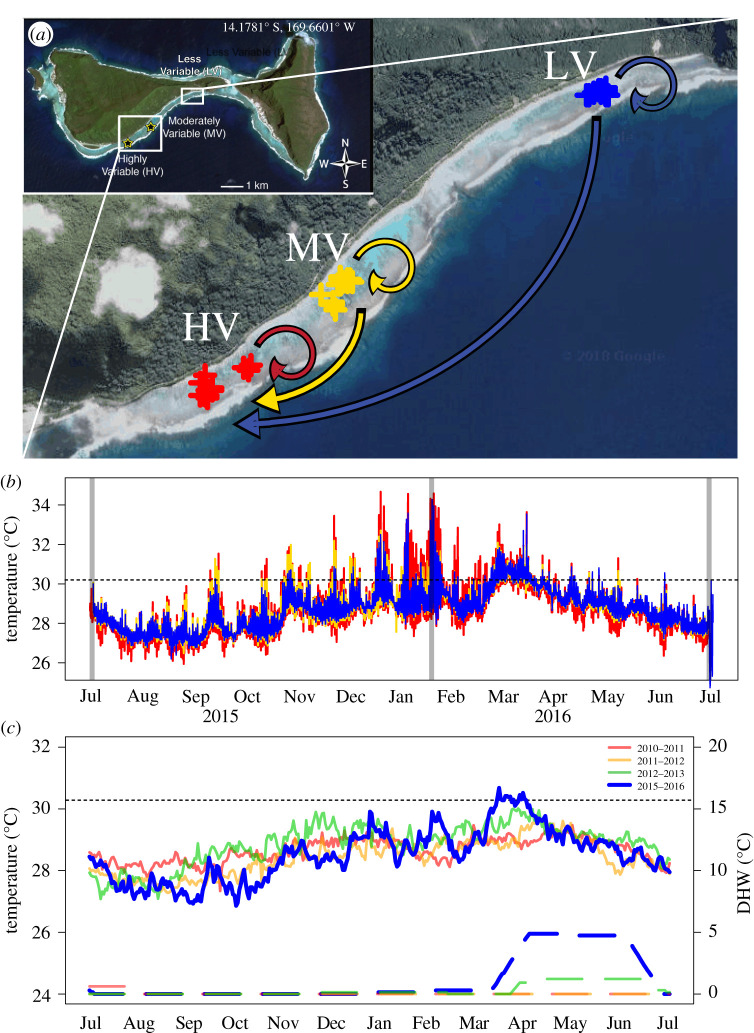
Figure 1.
(a) Map of Ofu Island, American Samoa. Arrows show transplant experiment design within three backreef pools—HV (red), MV (gold), LV (blue). (b) In situ site temperatures during the study period. Vertical grey lines represent the start of the experiment and data collection time points. (c) Comparison of sea surface temperatures (solid lines) and degree heating weeks (DHW; dashed lines) during years of this and a prior experiment. Temperatures were extracted from a National Oceanic and Atmospheric Administration, Coral Reef Watch 5 km Ofu Island dataset spanning the years 2010–2012 [8] and 2015–2016 (this study). Dotted lines represent the regional bleaching threshold, 30.2°C [48]. (Online version in colour.)

