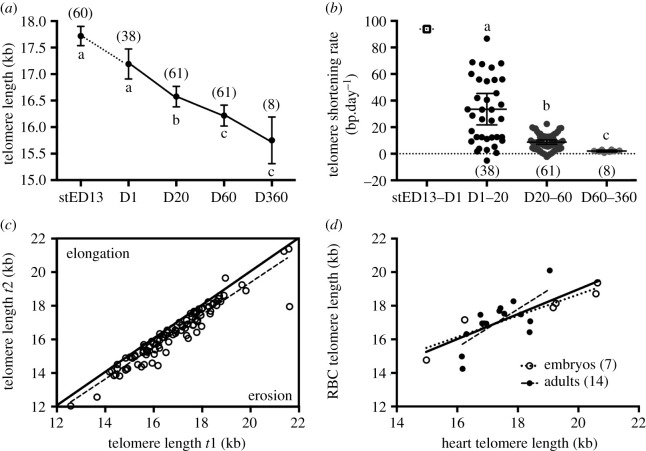
Figure 1.
Characterizing the telomere biology of Japanese quail. (a) Telomere lengths of Japanese quail red blood cells from embryogenesis to 360 days postnatal. stED13 represents a standardized developmental stage between experimental groups as explained in the main text methods. Data plotted as means ± se; solid lines linking means indicate longitudinal data and the dotted line cross-sectional data. (b) Intra-individual telomere shortening rate until 360 days postnatal. Data plotted as individual data points, with horizontal lines indicating means ± s.e. Cross-sectional average ‘shortening rate’ between stED13 and D1 is presented for illustration purposes. (c) Intra-individual consistency/repeatability of telomere length. Telomere length at the first sampling occasion (t1) is plotted against telomere length at the second sampling occasion (t2) for each consecutive measurement (i.e. D1 versus D20, D20 versus D60 and D60 versus 360) for each bird. Line of equality is presented as a solid line, while the dotted line represents the relationship in our dataset. (d) Correlation between heart and RBC telomere length in Japanese quail embryos (stED13) and adult individuals. Solid line represents the overall correlation while dotted lines represent stage-specific correlations. Letters indicate significant differences according to post-hoc tests, and numbers in brackets represent sample sizes.

