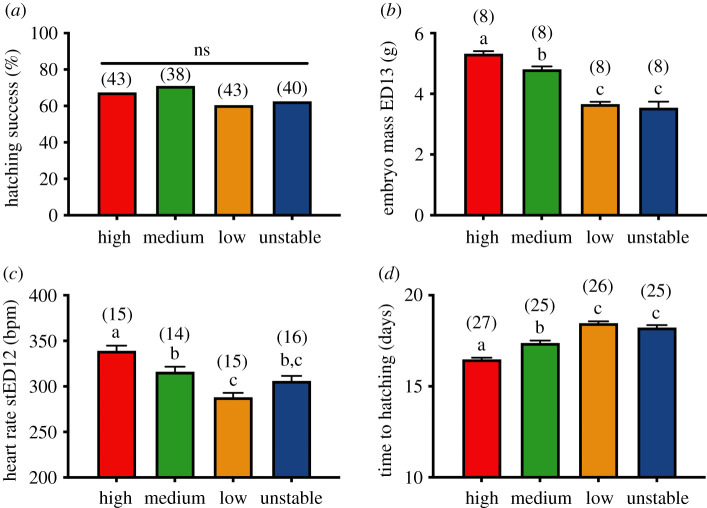
Figure 2.
Differences between the four incubation temperature treatment groups in: (a) hatching success, (b) embryo total mass at embryonic day 13 (ED13), (c) embryo heart rate at standardized embryonic day 12 (stED12), and (d) time from the beginning of incubation to hatching. Data plotted as means ± s.e. Details of statistical tests are given in the text, letters indicate significant differences according to post-hoc tests, and numbers in brackets represent sample size. (Online version in colour.)

