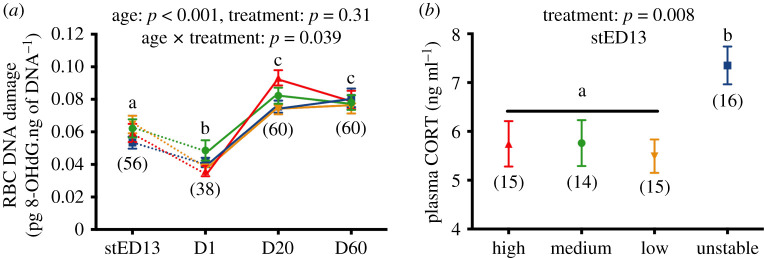
Figure 4.
Effects of experimental incubation temperatures on (a) changes in DNA damage levels with age, (b) plasma corticosterone (CORT) levels in embryos. stED13 represents a standardized developmental stage between experimental groups as explained in the methods; D1 = day after hatching, D20 = chick and D60 = adult. Data plotted as means ± s.e. Details of statistical tests are given in the text, solid lines indicate longitudinal data and dotted lines cross-sectional data, letters indicate significant differences according to post-hoc tests, and numbers in brackets represent sample sizes. (Online version in colour.)

