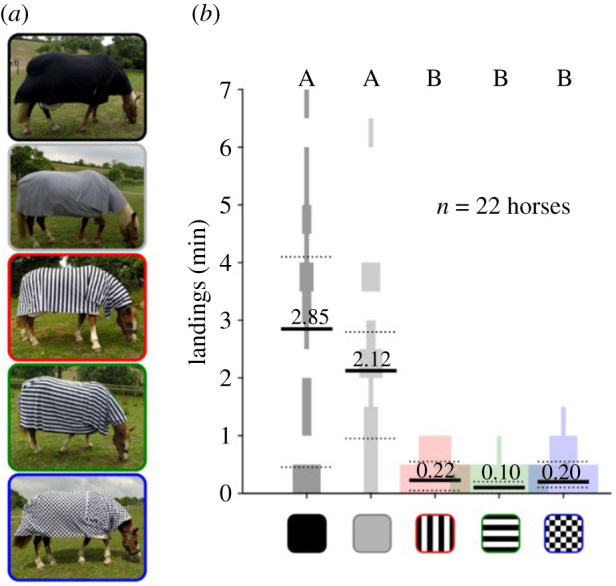
Figure 2.

(a) Custom-made fabric pinned over commercial horse rugs. Fabric was printed with uniform black, uniform grey, vertical stripe, horizontal stripe, and checked patterns. (b) Horsefly landing rate on each of the five patterned rugs. Black lines = median, dotted lines = 25th and 75th percentile, shaded areas = violin plot of the data. Letters above each column indicate which are statistically different (Friedman's test with multi-compare and Bonferroni correction, p < 0.05).
