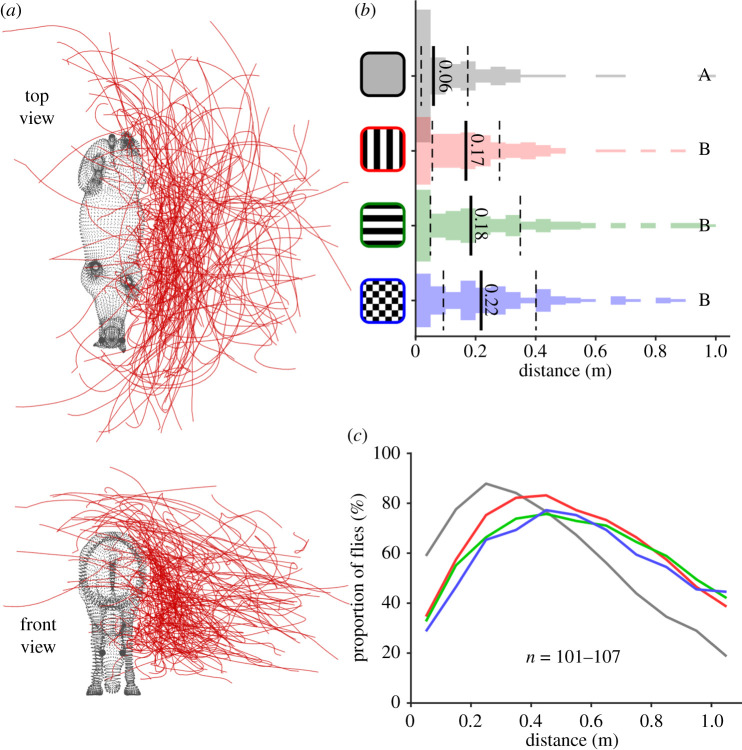
Figure 3.
Fly distance from horses wearing patterned rugs. (a) Dorsoventral (top) and anteroposterior (bottom) views of 107 fly trajectories plotted around the horse location (see also electronic supplementary material, figure S2 and movie S3). Each red line shows a single horsefly trajectory around horses wearing (in this case) the vertically striped rug. (b) Closest recorded distance of each fly to the horse (figure 2 for conventions). (c) Proportion of digitized fly trajectories at different distances from the host target, colour coded according to (b) (n = 101–107 fly trajectories per rug type).

