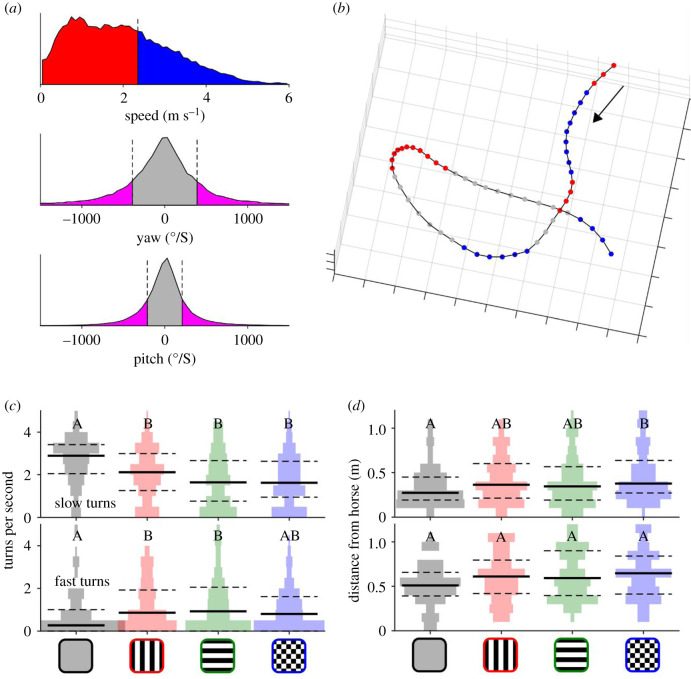
Figure 5.
Fly turning behaviour around horses wearing patterned rugs. (a) Histograms of speed, pitch, and yaw of pooled data demonstrating the cut-off points used to define slow/fast flight (red and blue, respectively) and turning/straight flight (pink and grey, respectively). (b) Example flight segmented into fast (blue) and slow (red) turns viewed from above. Black arrow indicates direction of flight. (c) Rate of slow (top) and fast (bottom) turns around the four rugs. (d) Distance of slow and fast turns from horses. See figure 2 for graph conventions for c and d.

