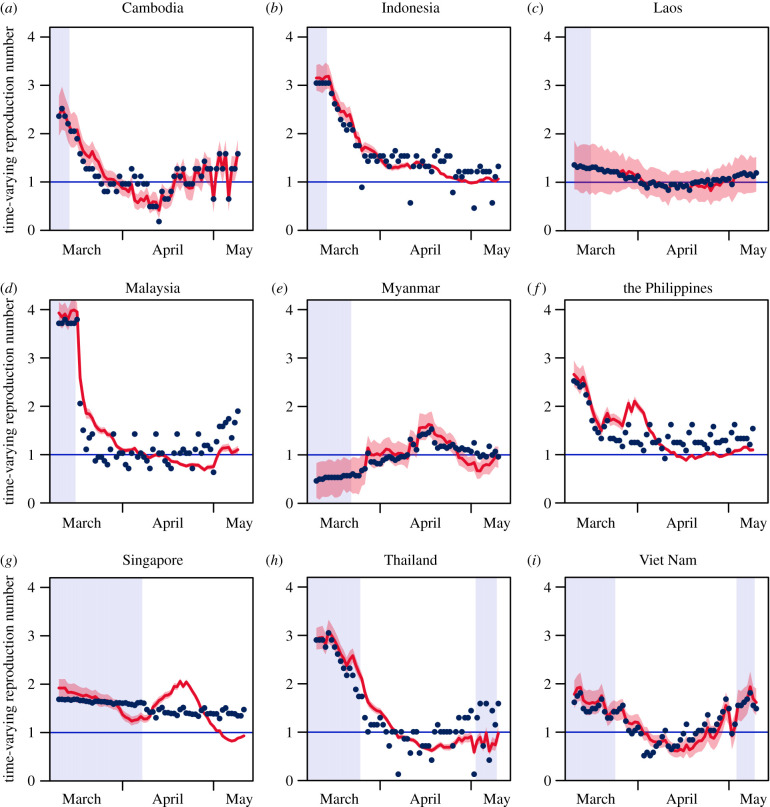
Figure 3.
Estimated time-varying reproduction number for SARS-CoV-2 across time across Southeast Asian countries from March 2020 to May 2020. Red lines represent the fitted time-varying reproduction number with the shaded area representing the implied density estimate. Blue points represent observed time-varying reproduction number. Highlighted areas represent time points where social distancing policies were not implemented. (Online version in colour.)

