Figure 6.

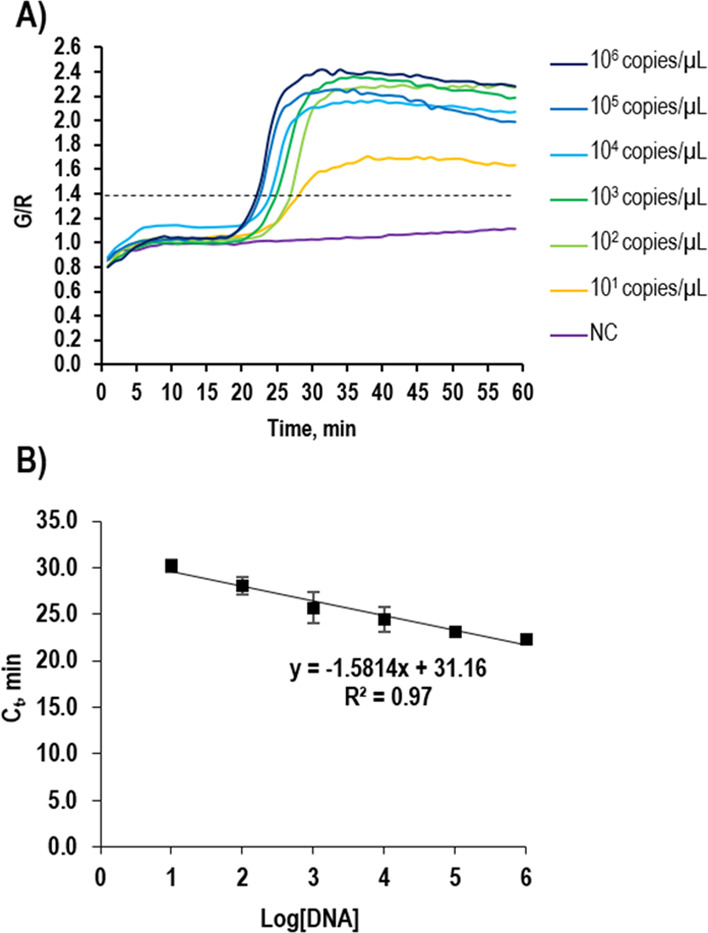
Quantification calibration curve. (A) LAMP profiles using various amounts of genomic DNAs of E. coli O157:H7 ranging from 101 to 106 copies/μL. (B) Linear regression plot of the Ct versus log(the amount of DNA).

Quantification calibration curve. (A) LAMP profiles using various amounts of genomic DNAs of E. coli O157:H7 ranging from 101 to 106 copies/μL. (B) Linear regression plot of the Ct versus log(the amount of DNA).