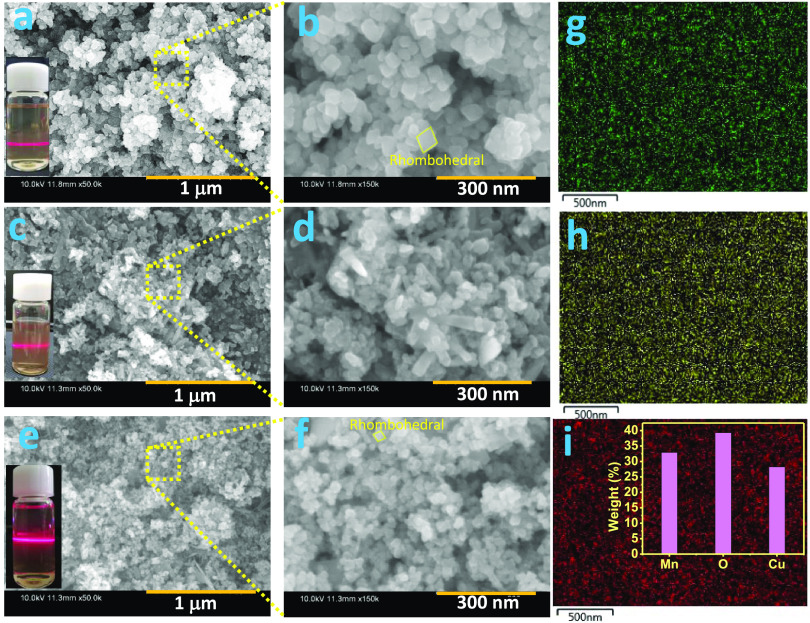
Figure 2.
FE-SEM images of (a, b) MO, (c, d) CO, and (e, f) CMO@MCO. EDS elemental mapping of (g) Mn, (h) O, and (i) Cu in CMO@MCO (the inset shows the elemental weight (%) of Mn, O, and Cu). Insets of (a), (c), and (e) present the photographic images of Tyndall light scattering experiments of MO, CO, and CMO@MCO, respectively.

