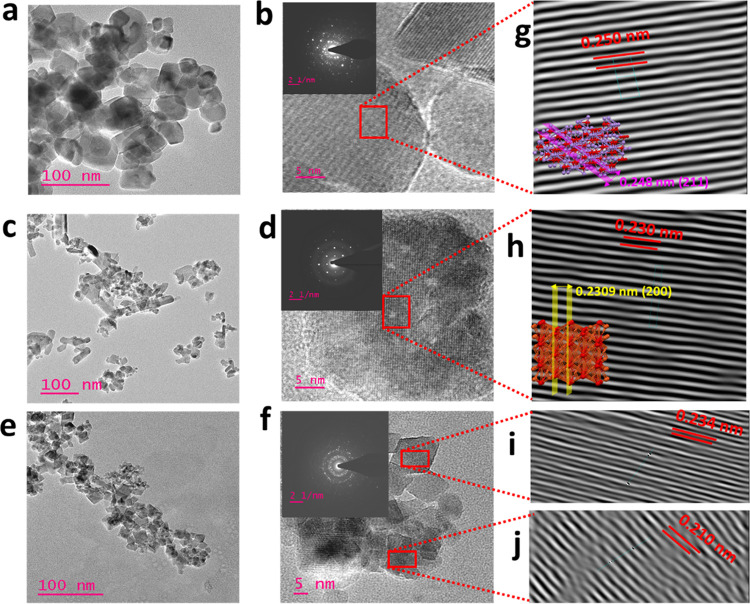
Figure 3.
HR-TEM images of (a, b) MO, (c, d) CO, and (e, f) CMO@MCO. Insets of (b), (d), and (f) show the SAED patterns of MO, CO, and CMO@MCO, respectively. Magnified calibrated lattice fringes of (g) MO (the inset shows the interplanar spacing of the (211) plane), (h) CO (the inset shows the interplanar spacing of the (200) plane), and (i, j) CMO@MCO.

