
Figure 2.
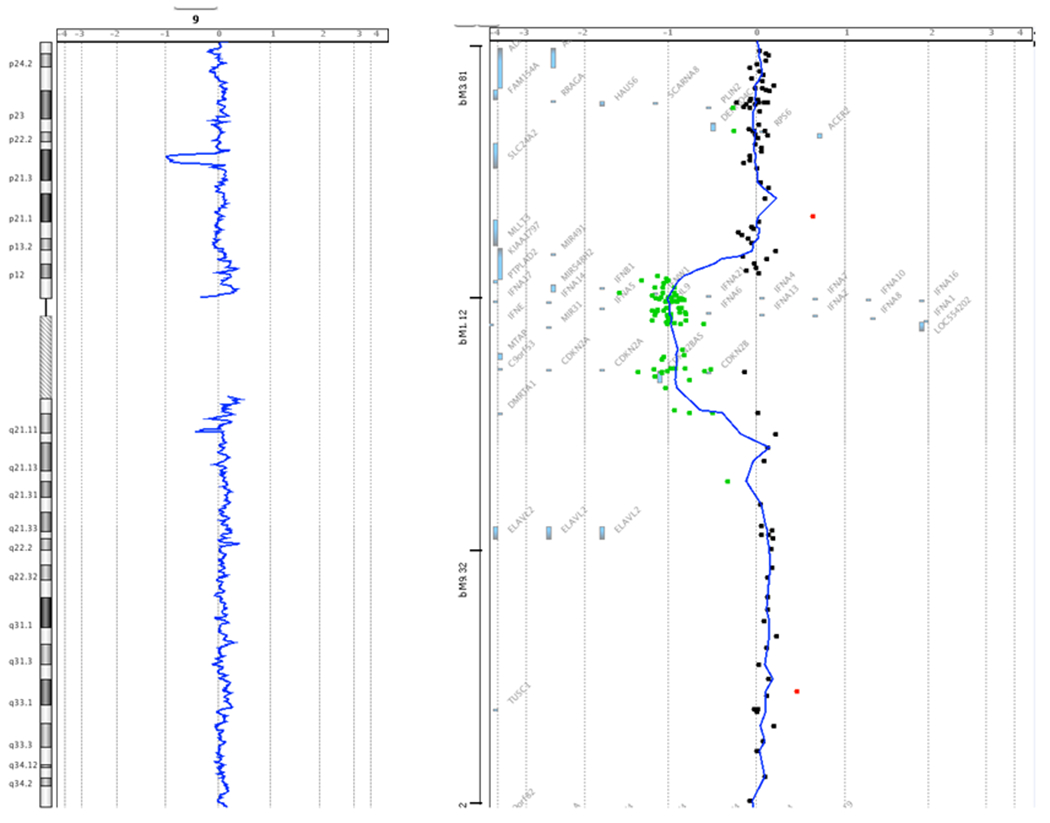
Array CGH Data. Figure 2A shows the location of the deletion within cytogenetic band 9p21.3. Figure 2B details the approximate 25 genes encompassed within the deleted region as identified in the proband. The green dots represent individual probe locations that are deleted in the proband compared to the reference DNA, based on the relative intensity of the signal. The probe locations are mapped in comparison to the genes in the genomic region. Red dots indicate probe locations whose intensity is increased in the proband relative to the reference DNA. Single probe deviations, whether red or green, represent hybridization noise. Images provided by GeneDx.