
Figure 4.
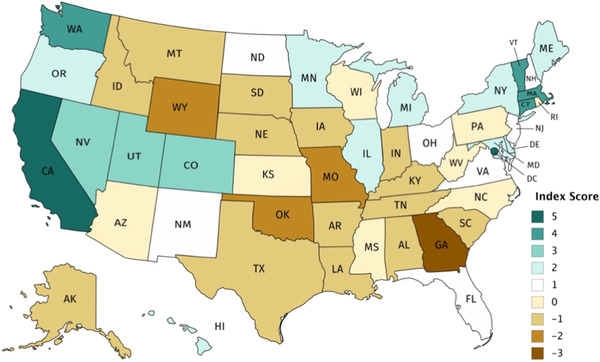
Composite Policy Index [Color figure can be viewed at wileyonlinelibrary.com]
To create the composite policy index, each state received a +1 for each protective policy that it had, a −1 for each restrictive policy, and a 0 if no policy existed.