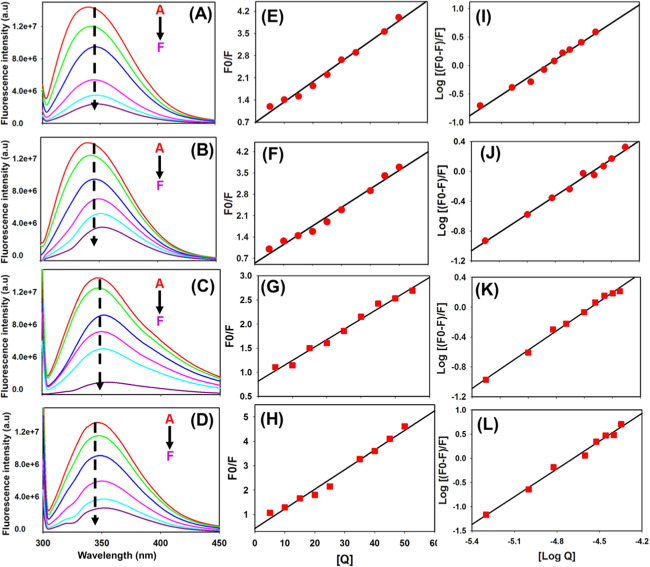
Figure 5.
Fluorescence quenching profiles of CCL2 orthologs: (A–D) Fluorescence quenching profiles of mCCL2-WT, mCCL2-P8A, hCCL2-WT, and hCCL2-P8A, respectively. (E–H) Stem–Volmer plots of mCCL2-WT, mCCL2-P8A, hCCL2-WT, and hCCL2-P8A, respectively. (I–L) Double-log plots of mCCL2-WT, mCCL2-P8A, hCCL2-WT, and hCCL2-P8A, respectively. In figure (A–D), the inset A–F represents Apo protein (without BA), protein–BA (1:0.1), protein–BA (1:0.2), protein–BA (1:0.4), protein–BA (1:0.5), protein–BA (1:0.7), and protein–BA (1: 1).

