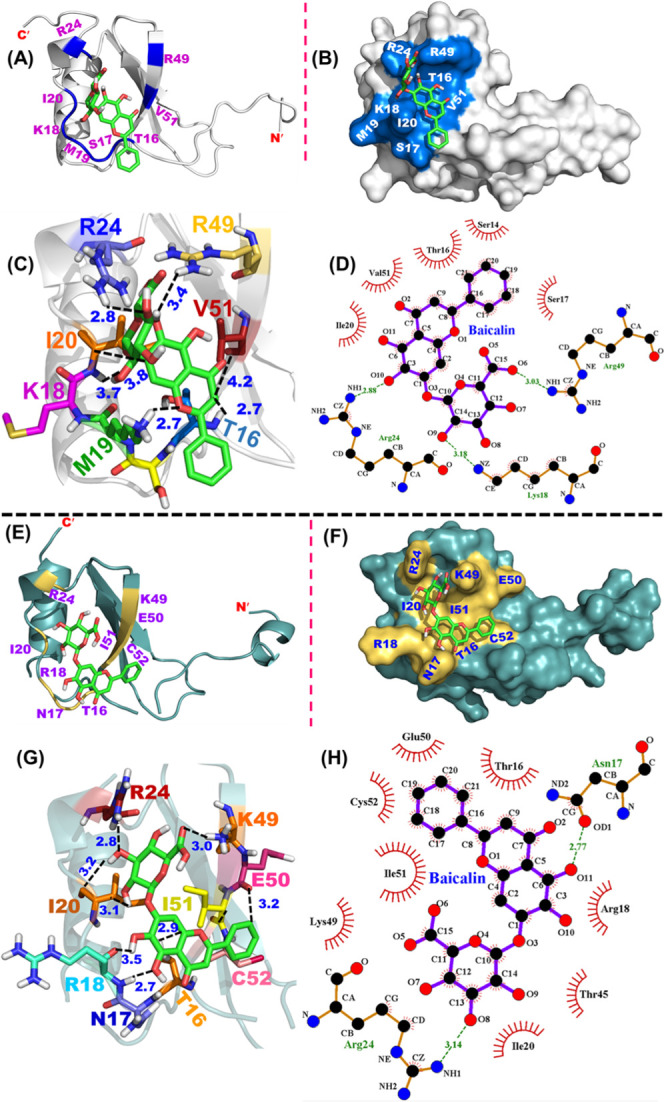
Figure 7.

Docking of BA on mCCL2-WT and hCCL2-WT proteins: (A) Docking of BA onto the mCCL2 monomer. The BA binding pocket is highlighted in marine blue, and the interacting residues are shown in purple. (B) Representation of the BA binding pocket onto the surface structure of the mCCL2 monomer. (C) BA–mCCL2 monomer depicting various interactions. Black dotted lines depict the interactions. Numbers in Å represent the spatial proximity of the interactions. (D) LigPlot showing the representative hydrogen bonding contacts and hydrophobic interactions in the BA–mCCL2 monomer complex. Dotted green lines indicate hydrogen bonding interactions, while the hydrophobic interactions are indicated by an arc along with spokes directing toward the ligand binding position. (E) Docking of BA onto the hCCL2 monomer. The BA binding pocket is highlighted in pale yellow, and the interacting residues are shown in purple. (F) Representation of the BA binding pocket onto the surface structure of the hCCL2 monomer. (G) BA–hCCL2 monomer depicting various interactions. Black dotted lines depict the interactions. Numbers in Å represent the spatial proximity of the interactions. (H) LigPlot showing the representative hydrogen bonding contacts and hydrophobic interactions in the BA–hCCL2 monomer complex. Dotted green lines indicate hydrogen bonding interactions, while the hydrophobic interactions are indicated by an arc along with spokes directing toward the ligand binding position.
