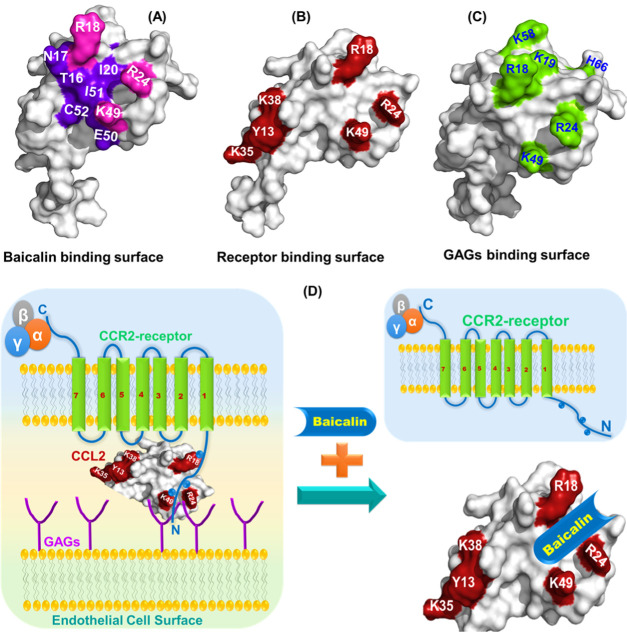
Figure 8.
Comparative analysis of baicalin binding surface with the receptor and GAG binding surfaces: (A) Surface representation of the hCCL2 monomer depicting the crucial BA binding residues (purple and pink). The overlapping residues among the receptor, GAG, and BA binding on the hCCL2 surface are highlighted in pink. (B) Surface representation of the hCCL2 monomer depicting the crucial receptor-binding residues (red). (C) Surface representation of the hCCL2 monomer depicting the crucial GAG binding residues (green). (D) Schematic showing the baicalin-induced dissociation of the receptor/GAG–CCL2 complex.

