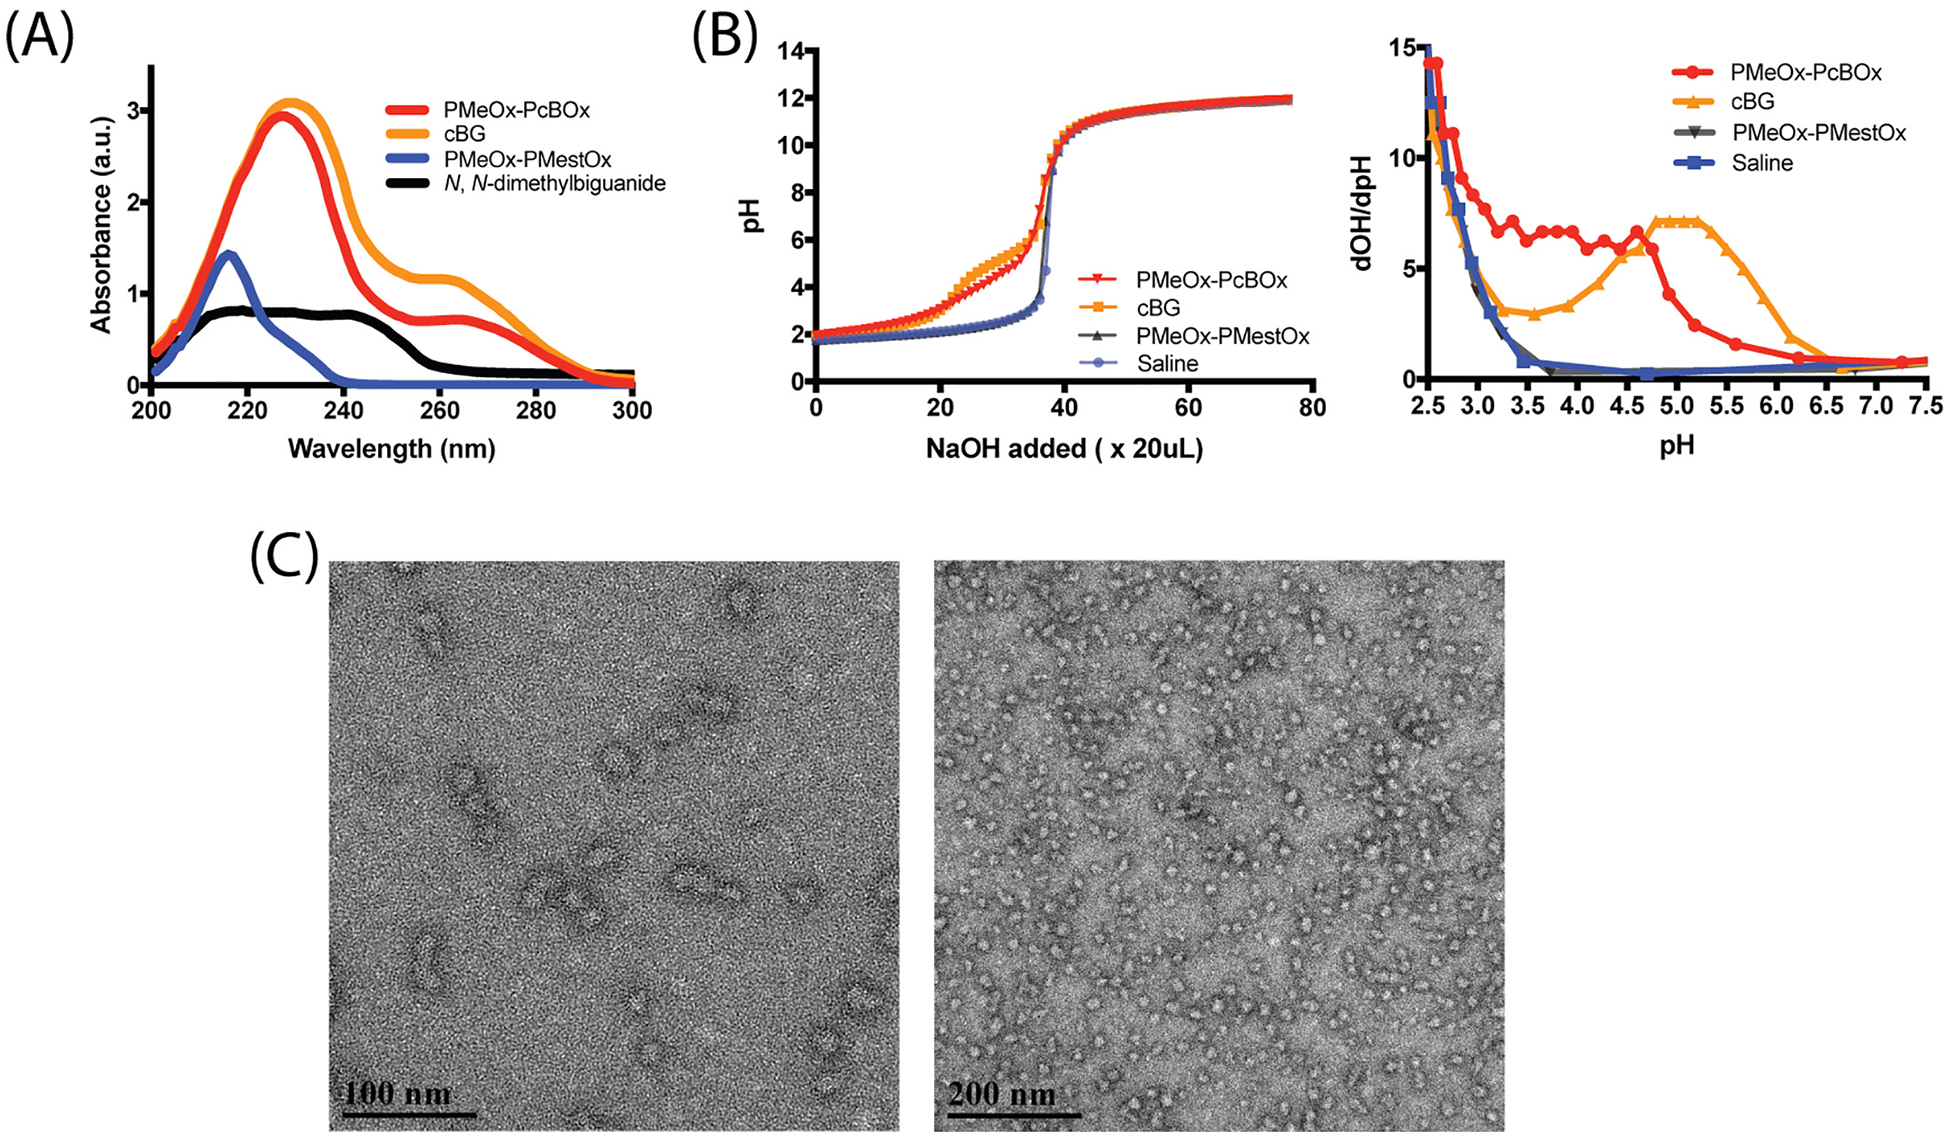
Fig. 2.

(A) UV spectra of PMeOx-PcBOx, cBG, PMeOx-PMestOx and N,N-dimethylbiguanide in the range of 200–300 nm. (B) Acid-base titration curves (left) and derivative plot dOH/dpH as a function of pH (right) of PMeOx-PcBOx, cBG, PMeOx-PMestOx and saline. (C) TEM image of self-assembled PMeOx-PcBOx. Scale bar = 200 nm (left), 50 nm (right).
