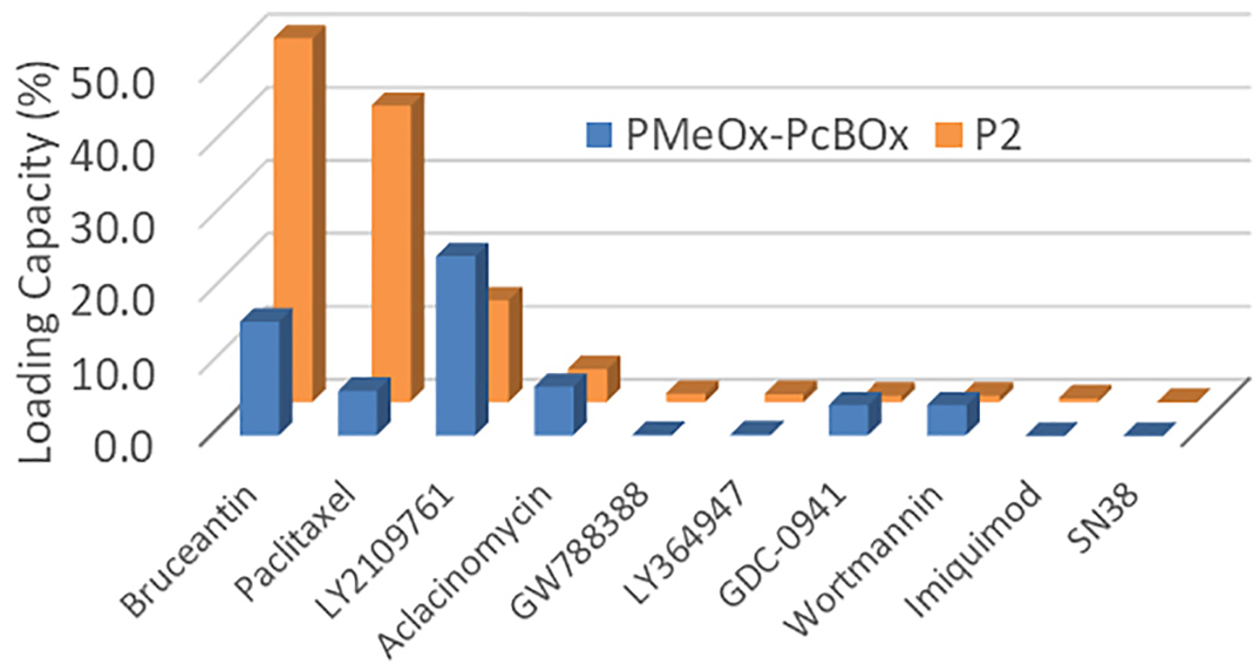
Fig. 3.

Differential solubilization of drugs indicated by their maximum LC in PMeOx-PcBOx (blue bars) and P2 (orange bars). Polymers concentration 10 mg/mL. (n = 3 for all drugs and polymers except for GW788388, GDC-0941, and LY364947 in PMeOx-PcBOx groups, which has n = 1). (For interpretation of the references to colour in this figure legend, the reader is referred to the web version of this article.)
