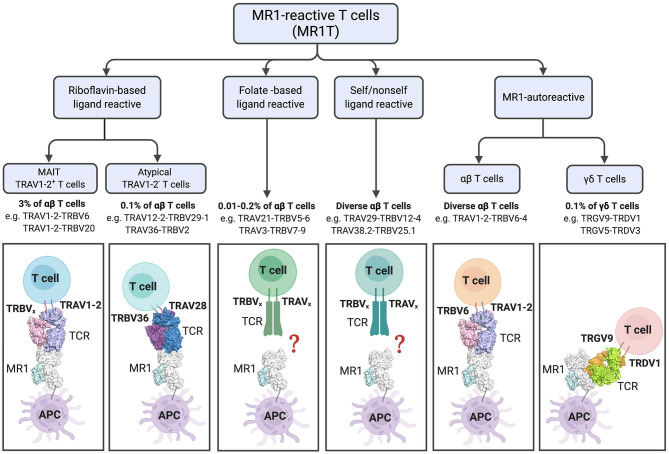
Figure 3.
Diversity and characteristics of MR1-reactive T cells. % refer to those reported in human PBMCs. For subsets with diverse TCRs examples are listed. The lower panel shows cartoon representations of the crystal structures of ternary TCR-MR1-Ag complexes: The typical MAIT A-F7 TRAV1-2-TRBV6-1 TCR-MR1-5-OP-RU (PDB; 6PUC); the atypical TRAV36-TRBV28 TCR-MR1-5-OP-RU (PDB; 5D7L); MR1-autorective M33.64 (TRAV1-2/TRBV6-4) TCR-MR1-5-OP-RU (PDB; 5D5M); and G7 γδ TCR with MR1-5-OP-RU complex (PDB; 6MWR). The MR1 and β2-microglobulin molecules are colored white and pale-cyan, respectively. TRAV1-2 TCRα, light-blue; TRAV6 TCRβ, light-pink; TRAV36 TCRα, violet-purple; TRBV28 TCRβ, sky-blue; TRGV9 TCRγ; lemon, TRDV1 TCRδ, orange. Structural illustration was created using PyMOL Molecular Graphics System, Version 1.8.6, Schrodinger and BioRender.com.

