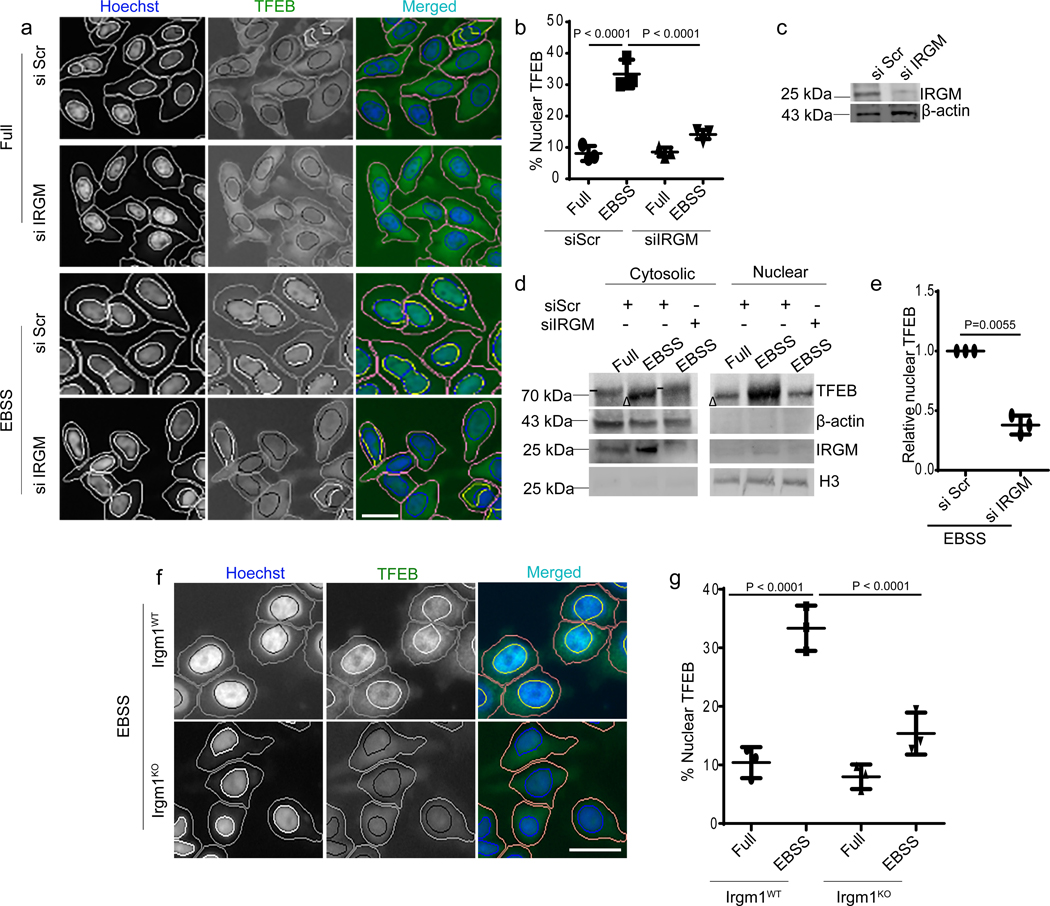
Fig. 1|. IRGM controls TFEB nuclear translocation.
a, b, High content microscopy (HCM) analysis of the effect of IRGM KD on nuclear translocation of TFEB (3 biologically independent experiments; >500 primary objects examined per well). Masks; magenta: algorithm-defined cell boundaries; blue: computer-identified nucleus; yellow outline: computer-identified colocalization between TFEB and Hoechst-33342 nuclear stain). Data, means ± SEM; (n=3 biologically independent experiments) ANOVA, Tukey’s post hoc test. Scale bar 10 μm. c, Western blot analysis of IRGM KD in HeLa cells used for experiments in a and b, n=3 biologically independent experiments. d,e, Western blot analysis of effects of IRGM knockdown on nuclear translocation of TFEB tested by sub-cellular fractionation (EBSS, 1 h starvation in EBSS). Triangle, mobility-shifted TFEB (dephosphorylated) TFEB; dash, unshifted TFEB. Data, means ± SEM of normalized intensities; paired t test. n=3 biologically independent experiments. f,g, BMMs isolated from Irgm1KO or WT mice were incubated in full medium or induced for autophagy using EBSS, stained with TFEB antibody (Thermo Pierce; # PA1–31552) and analyzed by HCM for TFEB nuclear translocation. Masks; magenta: algorithm-defined cell boundaries; blue: computer-identified nucleus; yellow outline: computer-identified colocalization between TFEB and Hoechst-33342 nuclear stain). The masks in gray scale panels are cloned from the merged images. Images, a detail from a large database of machine-collected and computer-processed images. Data, means ± SEM (n=3) ANOVA, Tukey’s post hoc test; n=3 biologically independent experiments; >500 primary object examined per well; minimum number of wells, 9. Scale bar 10 μm. Uncropped blots for panels c and d are provided in Unprocessed Blots Fig. 1 and numerical source data for panels b, e and g are provided in Statistical Source Data Fig. 1.

