
Extended Data Fig. 3. IRGM effects on mTOR and calcineurin and mAtg8s interactions with and effects on TFEB.
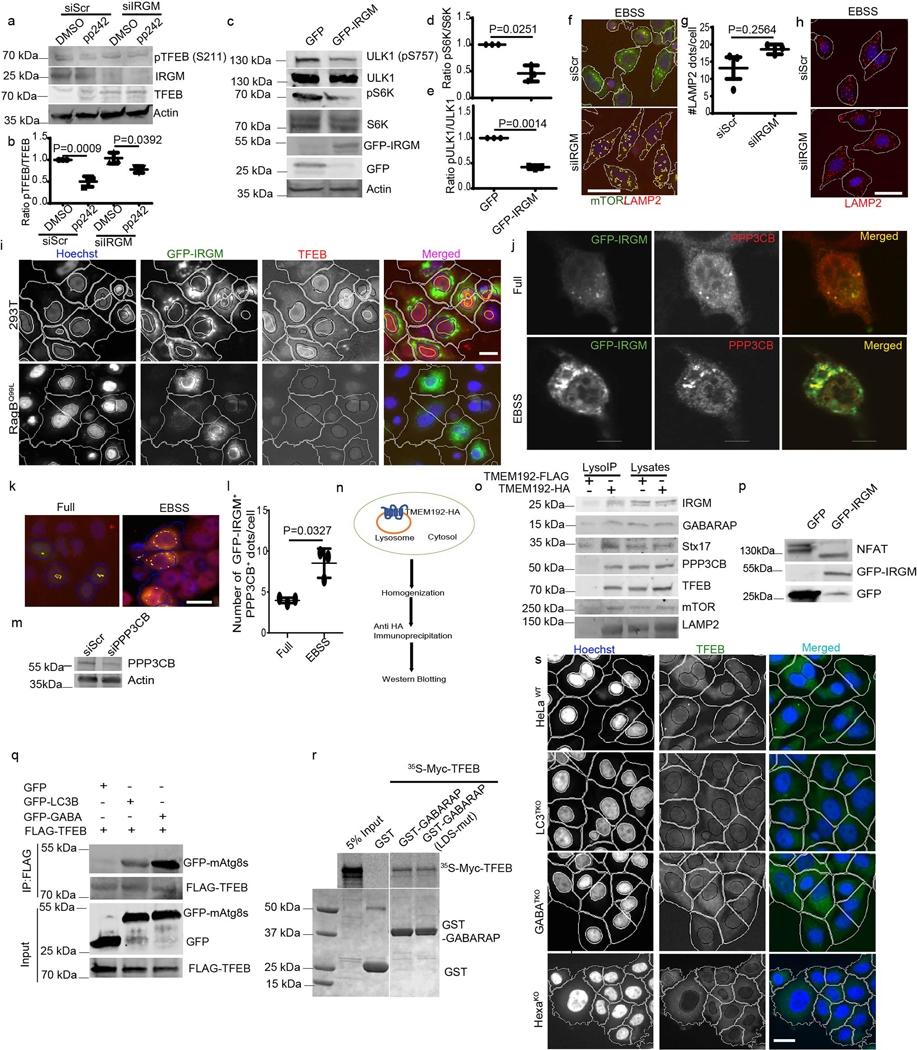
a, b, Western blot analysis and quantifications of the effects of IRGM KD on pTFEB (S211) levels in cells treated with pp242. Data, means ± SEM of normalized intensities (n=3 biologically independent experiments) ANOVA, Tukey’s post hoc test. c–e, western blots analysis of the effects of IRGM on mTOR substrates pS6K and pULK1. Data, means ± SEM of normalized intensities (n=3 biologically independent experiments) paired t-test. f, HCM image analysis of co-localization between mTOR and LAMP2. Scale bar 10 μm. g,h, HCM analysis of the effects of IRGM KD on LAMP2 puncta. Data, means ± SEM; (n=3 biologically independent experiments) paired t-test. Scale bar 10 μm. i, HCM analysis of the effect of IRGM expression on cells expressing RagBQ99L and parental 293T cells on nuclear translocation of TFEB, (n=3 biologically independent experiments). Scale bar 10 μm. j, confocal microscopy analysis of co-localization between GFP-IRGM and endogenous PPP3CB in HeLa cells (n=3 biologically independent experiments). Scale bar 5 μm. k,l, HCM analysis of the effect of starvation on colocalization between GFP-IRGM and PPP3CB. Data, means ± SEM (n=3 biologically independent experiments) paired t-test. Scale bar 10 μm. m, western blot showing PPP3CB KD in HeLa cells (n=3 biologically independent experiments). n, schematics of LysoIP technique. o, LysoIP to detect indicated proteins on lysosomes (n=3 biologically independent experiments). p, western blot analysis of the effects of IRGM expression on NFAT mobility shift (n=3 biologically independent experiments). q, Co-IP analysis of GFP-LC3B and GFP-GABARAP with FLAG-TFEB in 293T cells. r, GST pull-down analysis of TFEB with WT or LDS mutant of GABARAP. s, HCM images in WT or HexaKO cells (n=3 biologically independent experiments). Scale bar 10 μm. Uncropped blots for panels a, c, o, p, q and r are provided in Unprocessed Blots Data Extended Fig. 3 and numerical source data for panels b, d, e, g and l are provided in Statistical Source Data Extended Fig. 3.