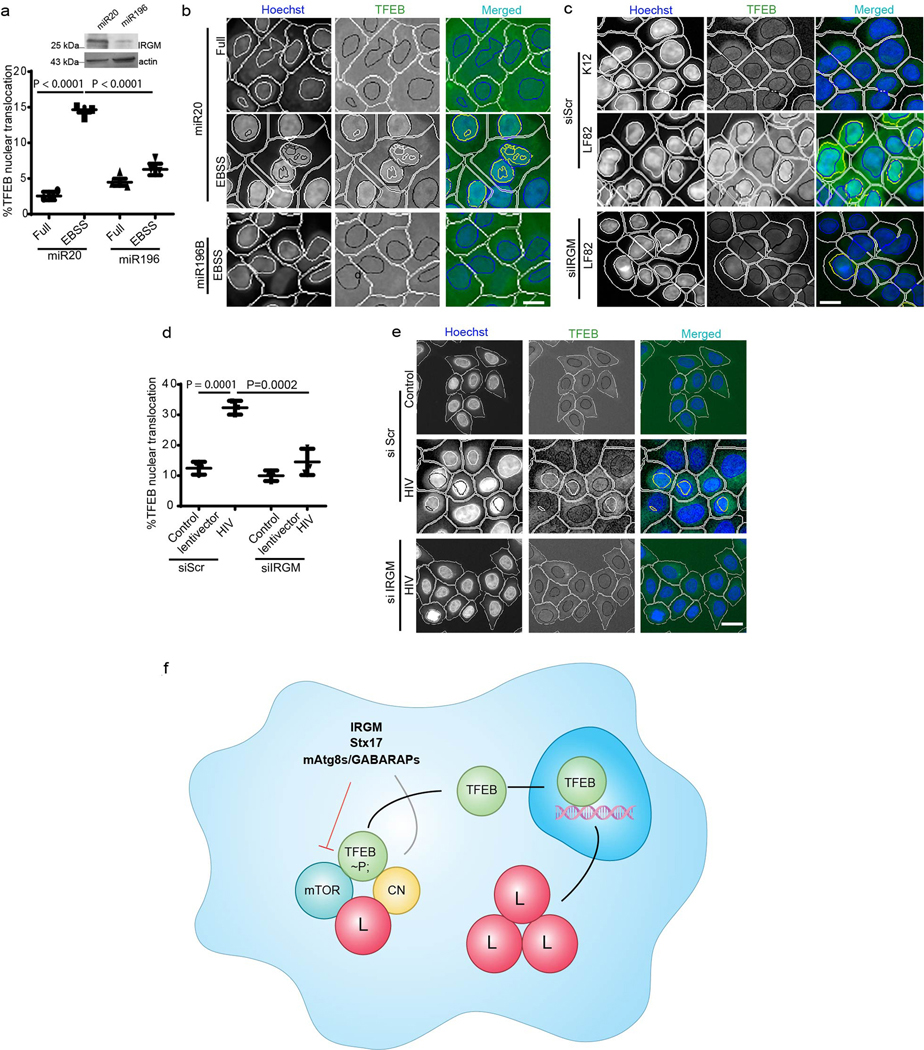
Extended Data Fig. 7. mIR196B affects protective CD variant of IRGM in its role in nuclear translocation of TFEB.
a,b, HCM analysis of the effects of miR196B (shown to downregulate CD protective IRGM variant) and miR20 (control) transfection on TFEB nuclear localization in 293T cells (c.313C). HCM (n=3 biologically independent experiments); >500 primary objects examined per well; minimum number of wells, 9). Masks; white: algorithm-defined cell boundaries; blue: computer-identified nucleus; yellow outline: computer-identified colocalization between TFEB and Hoechst-33342 nuclear stain). Images, a detail from a large database of machine-collected and computer-processed images. Data, means ± SEM; (n=3 biologically independent experiments) ANOVA, Tukey’s post hoc test. Scale bar 10 μm. c, HCM image analysis of the effects of IRGM KD on AIEC LF82 influenced nuclear translocation of TFEB. K12 was used as control, (n=3 biologically independent experiments). Scale bar 10 μm. d,e, HC microscopy and quantifications to analyze the effect of HIV infection on TFEB localization in HeLa cells transfected with scramble siRNA or IRGM siRNA. HC microscopy (n=3 biologically independent experiments; >500 primary objects examined per well; minimum number of wells, 12). Masks; white: algorithm-defined cell boundaries; blue: computer-identified nucleus; yellow outline: computer-identified colocalization between TFEB and Hoechst-33342 nuclear stain). Images, a detail from a large database of machine-collected and computer-processed images. Data, means ± SEM; (n=3 biologically independent experiments) ANOVA, Tukey’s post hoc test. Scale bar 10 μm. f, The model summarizes the effects of IRGM, Stx17 and mAtg8s/GABARAPs on mTOR inhibition and calcineurin (CN) activation promoting nuclear translocation of TFEB. L, lysosome. Numerical source data for panels a and d are provided in Statistical Source Data Extended Fig. 7.

