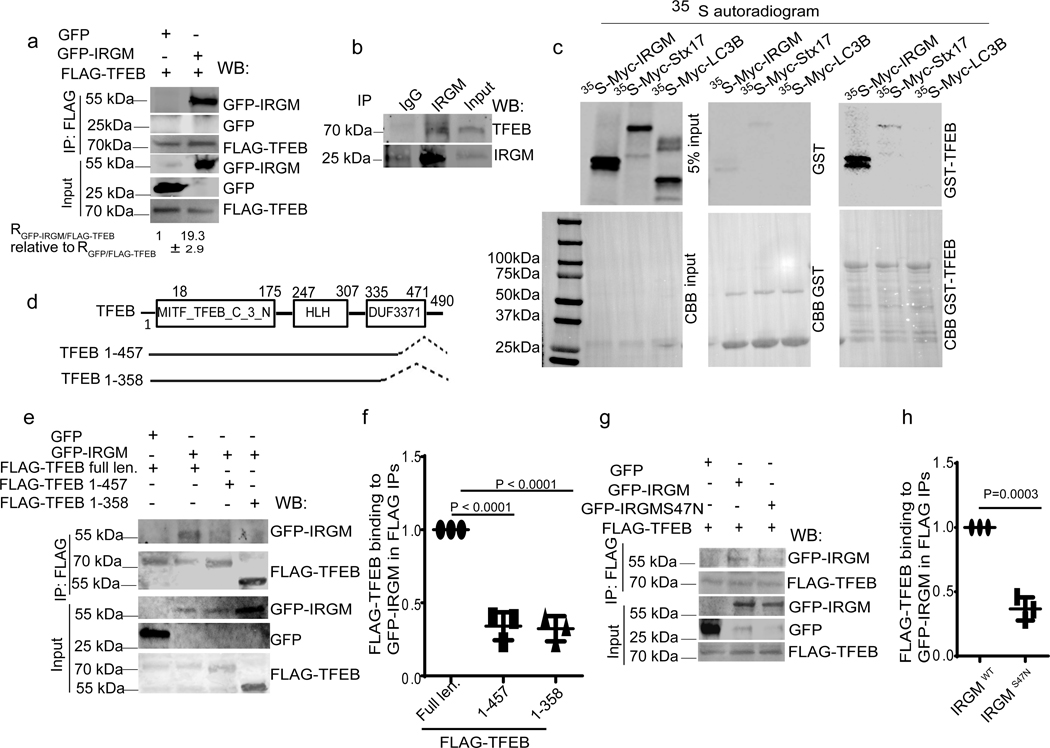
Fig. 2|. IRGM and TFEB interact.
a, Co-IP analysis of interactions between FLAG-TFEB and GFP-IRGM in 293T cells, (n=3 biologically independent experiments). b, Co-IP analysis of interactions between endogenous IRGM and TFEB in 293T cells, (n=3 biologically independent experiments). c, GST pull-down analysis of radiolabelled [35S] Myc-IRGM and [35S]Myc-Stx17 and [35S]Myc-LC3B with GST-TFEB, (n=3). d, Mapping of TFEB sites on IRGM. e,f, Co-IP analysis of interactions between GFP-IRGM and different TFEB mutants. Data, means ± SEM of intensities normalized to IP input; (n=3 biologically independent experiments) ANOVA, Tukey’s post hoc test. g, h, Co-IP analysis of interactions between FLAG-TEFB and GFP-IRGM wild type (IRGMwt) or GFP-IRGMS47N mutant. Data, means ± SEM of intensities normalized to IP input; paired t-test, n=3 biologically independent experiments. Uncropped blots for panels a, b, c, e and g are provided in Unprocessed Blots Fig. 2 and numerical source data for panels f and h are provided in Statistical Source Data Fig. 2.

