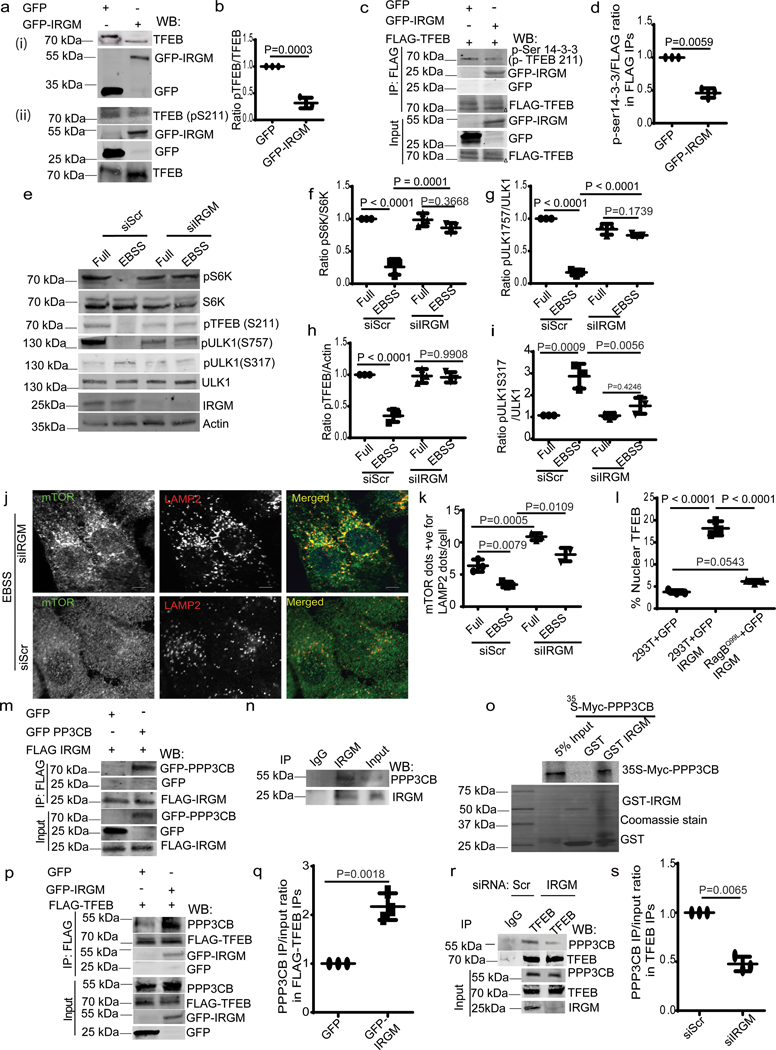
Fig. 3|. IRGM affects mTOR activity and interacts with PPP3CB.
a (i), Mobility shift of TFEB in GFP-IRGM expressing 293T cells. a(ii),b, effects of IRGM expression on phosphorylated TFEB. Data, means ± SEM of intensities normalized, TFEB (pS211)/TFEB paired t-test (n=3 biologically independent experiments). c, d, Co-IP analysis of effects of IRGM expression on TFEB phosphorylation using Phospho-(Ser) 14-3-3 antibody in immunoprecipitated FLAG-TFEB in 293T cells. Triangle, shifted TFEB band. Data, means ± SEM IP/input; paired t-test (n=3 biologically independent experiments). e–i, western blot analysis of the effects of IRGM KD on mTOR and AMPK (pULK1 S317) targets in cells incubated in full media or in EBSS for 2h. Data, means ± SEM of intensities of phosphorylated/total levels of proteins (n=3 biologically independent experiments) ANOVA, Tukey’s post hoc test. j, confocal microscopy analysis of the effects of IRGM-KD on colocalization between mTOR and LAMP2 in HeLa cells induced for autophagy (EBSS 2h), (n=3 biologically independent experiments). k, HCM analysis of the effects of IRGM-KD on colocalization between mTOR and LAMP2 in HeLa cells. Data, means ± SEM (n=3 biologically independent experiments) ANOVA, Tukey’s post hoc test. l, HCM analysis of the effects of IRGM expression in cells stably expressing RagBQ99L, on nuclear translocation of TFEB. Data, means ± SEM (n=3 biologically independent experiments) ANOVA, Tukey’s post hoc test. Scale bar 10 μm. m,n, Co-IP analysis of GFP-PPP3CB and FLAG-IRGM and endogenous IRGM and PPP3CB in 293Tcells (n=3 biologically independent experiments). o, GST pull-down of Myc-PPP3CB with GST-IRGM, (n=3 biologically independent experiments). p, q, Co-IP analysis of effects of IRGM expression on interactions between FLAG-TFEB and endogenous PPP3CB in 293T cells. Data, normalized intensity means ± SEM; paired t test (n=3 biologically independent experiments). r, s, Co-IP analysis of the effects of IRGM-KD on interactions between FLAG-TFEB and endogenous PPP3CB in 293T cells. Data, means ± SEM; n=3 biologically independent experiments (paired t test). Uncropped blots for panels a (i), a (ii), c, e, m, n, o, p and r are provided in Unprocessed Blots Fig. 3 and numerical source data for panels b, d, f, g, h, i, k, l, q and s are provided in Statistical Source Data Fig. 3.

