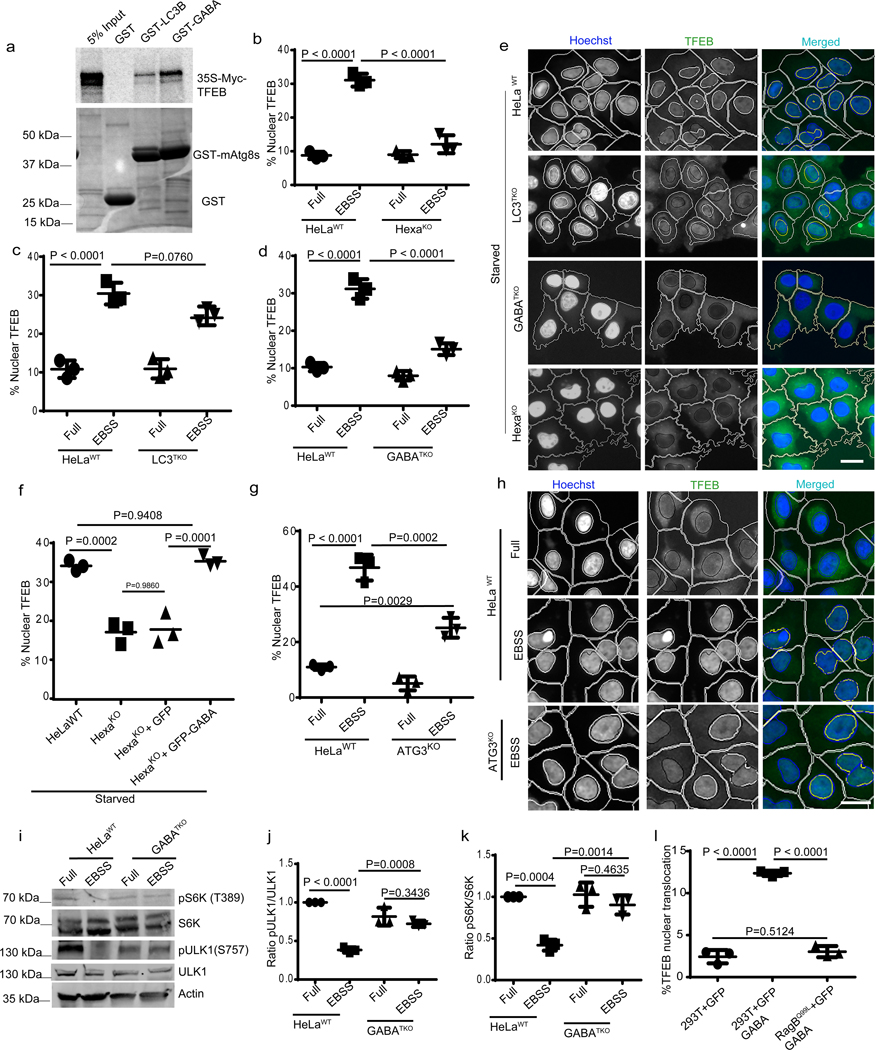
Fig. 4|. mAtg8s affect mTOR and nuclear translocation of TFEB.
a, GST pull-down of radiolabelled [35S]Myc-TFEB with GST-LC3B or GST-GABARAP, (n=3 biologically independent experiments). b–e, HCM images and quantification to test the effects of HexaKO (b), LC3TKO (c) and GABATKO (d) on TFEB translocation in response to starvation by 2h incubation in EBSS. Data, means (n=3 biologically independent experiments) ANOVA, Tukey’s post hoc test. Masks; white: algorithm-defined cell boundaries; blue: computer-identified nucleus; yellow outline: computer-identified co-localization between TFEB and nucleus. The masks in gray scale panels are cloned from the merged images. Data, 3 independent experiments; >500 primary objects examined per well; minimum number of wells, 9. f, HCM quantification to test the effect of complementation of HexaKO cells with GFP or GFP-GABARAP on nuclear translocation of TFEB in response to starvation. Data, means ± SEM; (n=3 biologically independent experiments) ANOVA, Tukey’s post hoc test 3 independent experiments; >500 primary object examined per well; minimum number of wells, 9. g,h, HCM images and quantification to test the effect of ATG3KO on nuclear translocation of TFEB in response to starvation. Data, means ± SEM; (n=3 biologically independent experiments) ANOVA, Tukey’s post hoc test. Masks; white: algorithm-defined cell boundaries; blue: computer-identified nucleus; yellow outline: computer-identified co-localization between TFEB and nucleus. i–k, western blot analysis of the effect of GABATKO on mTOR activity (measured by phosphorylated ULK1 and S6K) in response to starvation (2h EBSS). Data, means ± SEM of intensities of phosphorylated proteins normalized to levels of total proteins; (n=3 biologically independent experiments) ANOVA, Tukey’s post hoc test. l, HCM quantifications to test the effect of GFP-GABARAP on nuclear translocation of TFEB in parental 293T cells or cells constitutively expressing RagBQ99L. Data, means ± SEM ANOVA, Tukey’s post hoc test; HCM, >500 cells counted per well; minimum number of valid wells 9, n=3 biologically independent experiments. Uncropped blots for panels a and i are provided in Unprocessed Blots Fig. 4 and numerical source data for panels b, c, d, f, g, j, k and l are provided in Statistical Source Data Fig. 4.

