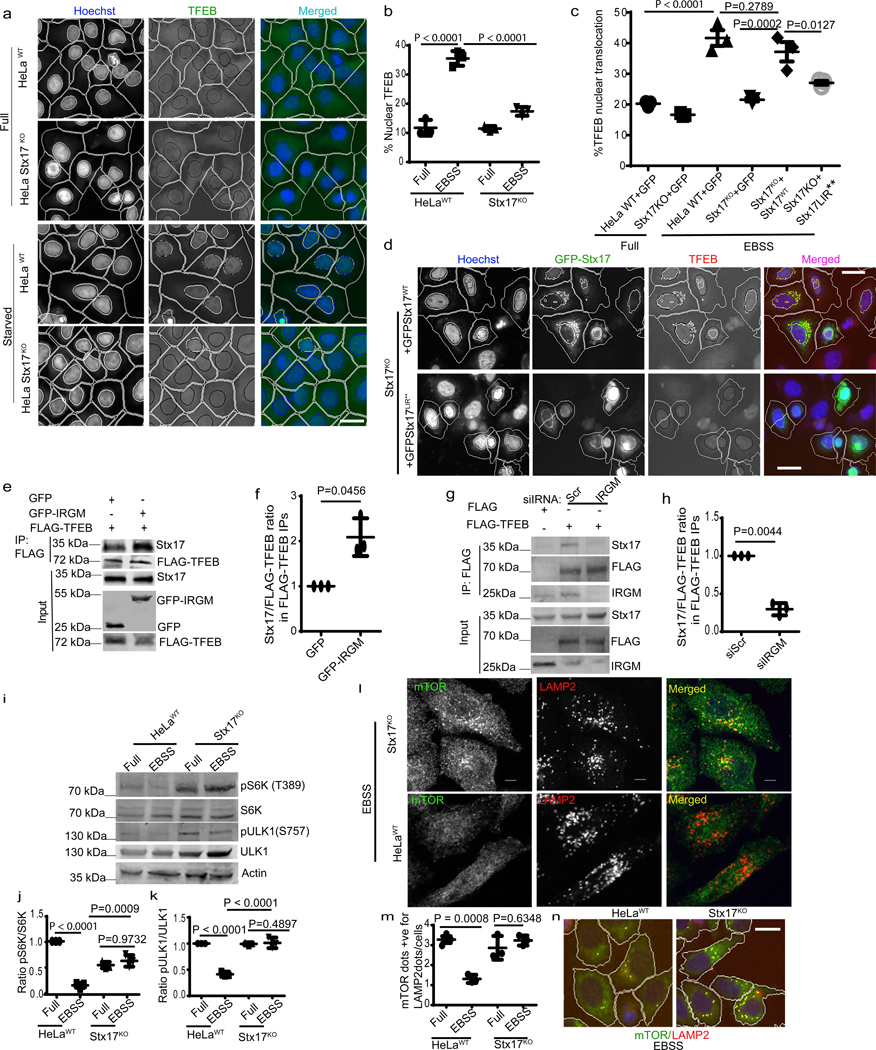
Fig. 6|. Stx17 affects mTOR and regulates TFEB nuclear translocation.
a,b, HCM analysis of effect on EBSS (2h) on nuclear translocation of TFEB in HeLaWT or Stx17KO cells. Data, means ± SEM; (n=3 biologically independent experiments) ANOVA, Tukey’s post hoc test; >500 primary objects examined per well; minimum number of wells, 9. Masks; white: algorithm-defined cell boundaries; blue: computer-identified nucleus; yellow outline: computer-identified co-localization between TFEB and nucleus). c,d, HCM images and quantification to test the effect of complementation of Stx17KO cells with GFP-Stx17WT or GFP-Stx17LIR** on nuclear translocation of TFEB. Data, means ± SEM (n=3 biologically independent experiments) ANOVA, Tukey’s post hoc test; HCM, >500 cells counted per well; minimum number of valid wells 9. Masks; white: algorithm-defined cell boundaries and computer-identified GFP positive cells; blue outline: nuclear stain; yellow outline: co-localization between TFEB and nucleus). Scale bar 10 μm. e,f, Co-IP analysis of FLAG-TFEB and endogenous Stx17 in the presence of GFP or GFP-IRGM in 293T cells. (f) Stx17 intensities normalized to FLAG-TFEB intensities in FLAG IPs. Data, means ± SEM of normalized intensities; (n=3 biologically independent experiments) paired t-test. g,h, Co-IP analysis of the effect of IRGM KD on interactions between FLAG-TFEB and endogenous Stx17 in 293T cells. Graph in h, Stx17 intensities normalized to FLAG-TFEB intensities in FLAG IPs. Data, means ± SEM of normalized intensities; (n=3 biologically independent experiments) paired t-test. i–k, Western blot analysis of the effects of Stx17KO on mTOR activity (measured by phosphorylation of ULK1 and S6K) in response to starvation (EBSS 2h). Data, means ± SEM of intensities of phosphorylated proteins normalized to total levels of proteins; (n=3 biologically independent experiments) ANOVA, Tukey’s post hoc test. l–n, confocal microscopy analysis (l) and HCM quantifications of the effect of Stx17KO on colocalization between mTOR and LAMP2. Data, means ± SEM; ANOVA, Tukey’s post hoc test; (n=3 biologically independent experiments). Masks; white: algorithm-defined cell boundaries; yellow outline: computer-identified co-localization between mTOR and LAMP2. Scale bar 10 μm. Uncropped blots for panels e, g and i are provided in Unprocessed Blots Fig. 6 and numerical source data for panels b, c, f, h, j, k and m are provided in Statistical Source Data Fig. 6.

