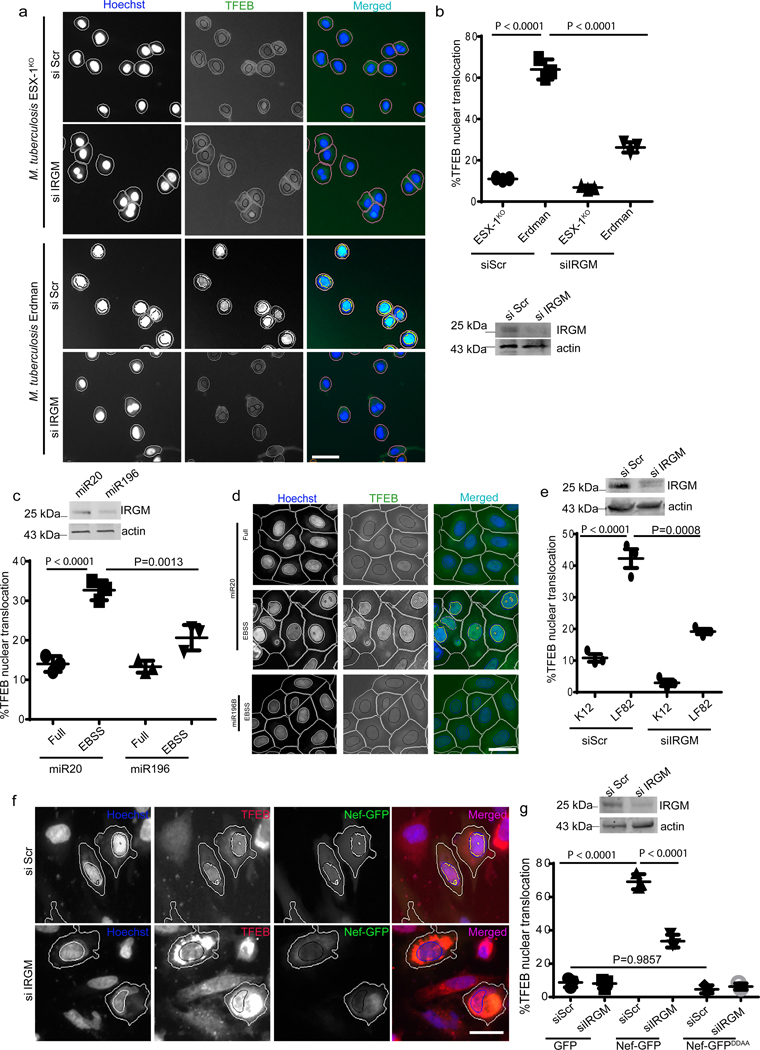
Fig. 7|. IRGM affects TFEB nuclear translocation in cells infected with diverse pathogens associated with tuberculosis, AIDS or Crohn’s disease.
a,b, THP-1 cells were knocked down for IRGM, infected with M. tuberculosis (wild type Erdman or its ESX-1 mutant), cells immuno-stained for TFEB, and nuclear translocation of TFEB analyzed by high content microscopy. Data, means ± SEM; ANOVA, Tukey’s post hoc test (n=3 biologically independent experiments); high content microscopy, >500 cells counted per well; minimum number of valid wells 9, 3 independent experiments. Masks; magenta: algorithm-defined cell boundaries; blue: computer-identified nucleus; green: computer identified TFEB; yellow outline: computer-identified colocalization between TFEB and Hoechst-33342 nuclear stain). Scale bar 10 μm. c,d, HCM images and quantifications to test the effect of miR196B transfection in HeLa cells on nuclear translocation of TFEB. miR20 was used as a control, (n=3 biologically independent experiments). Data, means ± SEM (ANOVA, Tukey’s post hoc test). e, HCM quantifications of the effect of IRGM KD on LF82 influenced nuclear translocation of TFEB in THP-1 cells, K12 was used as a control. Data, means ± SEM (n=3 biologically independent experiments) ANOVA, Tukey’s post hoc test. f,g, HCM images and quantifications to test the effect of IRGM KD on NEF mediated nuclear translocation of TFEB. NEF-DDAA was used as control. Data, means ± SEM (n=3 biologically independent experiments) ANOVA, Tukey’s post hoc test; high content microscopy, >500 cells counted per well; minimum number of valid wells 12 (n=3 biologically independent experiments). Masks; white: algorithm-defined cell boundaries and computer-identified GFP positive cells; blue outline: computer-identified nuclear stain; yellow outline: computer-identified colocalization between TFEB and Hoechst-33342 nuclear stain). Scale bar 10 μm. The masks in gray scale panels are cloned from the merged images. Western blot confirming IRGM knock down in cells used for the experiment. Uncropped blots for panels c, e and g are provided in Unprocessed Blots Fig. 7 and numerical source data for panels b, c, e and g are provided in Statistical Source Data Fig. 7.

