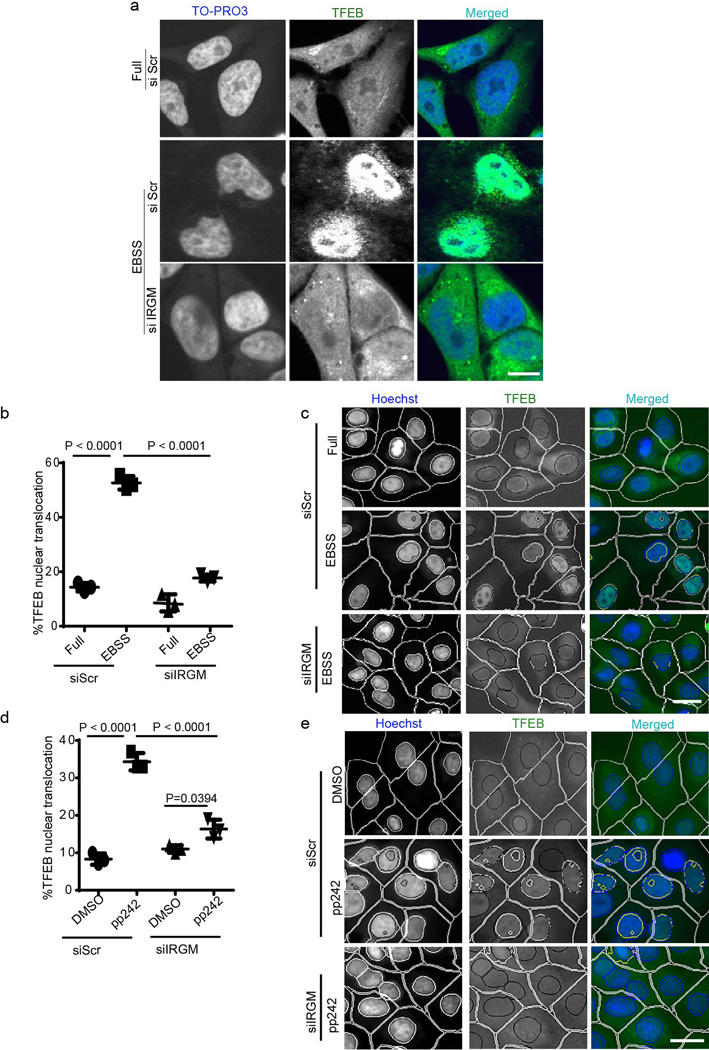
Extended Data Fig. 1. IRGM affects nuclear translocation of TFEB.
a, confocal microscopy analysis of effects of IRGM KD on TFEB nuclear translocation in response to 2h starvation. Scale bar 5 μm, (n=3 biologically independent experiments). b,c, HCM images and quantification to test the effect of IRGM KD on nuclear translocation of TFEB. Cells were permeabilized with Triton. Data, means ± SEM (n=3 biologically independent experiments) ANOVA, Tukey’s post hoc test; high content microscopy, >500 cells counted per well; minimum number of valid wells 9. Masks; white: algorithm-defined cell boundaries; yellow outline: computer-identified colocalization between TFEB and Hoechst-33342 nuclear stain). Scale bar 10 μm. d,e, HCM images and quantifications to test the effect of IRGM KD on nuclear translocation of TFEB in cells treated with DMSO or pp242. Data, means ± SEM (n=3 biologically independent experiments) ANOVA, Tukey’s post hoc test; high content microscopy, >500 cells counted per well; minimum number of valid wells . Masks; white: algorithm-defined cell boundaries; yellow outline: computer-identified colocalization between TFEB and Hoechst-33342 nuclear stain). Scale bar 10 μm. Numerical source data for panels b and d are provided in Statistical Source Data Extended Fig. 1.

