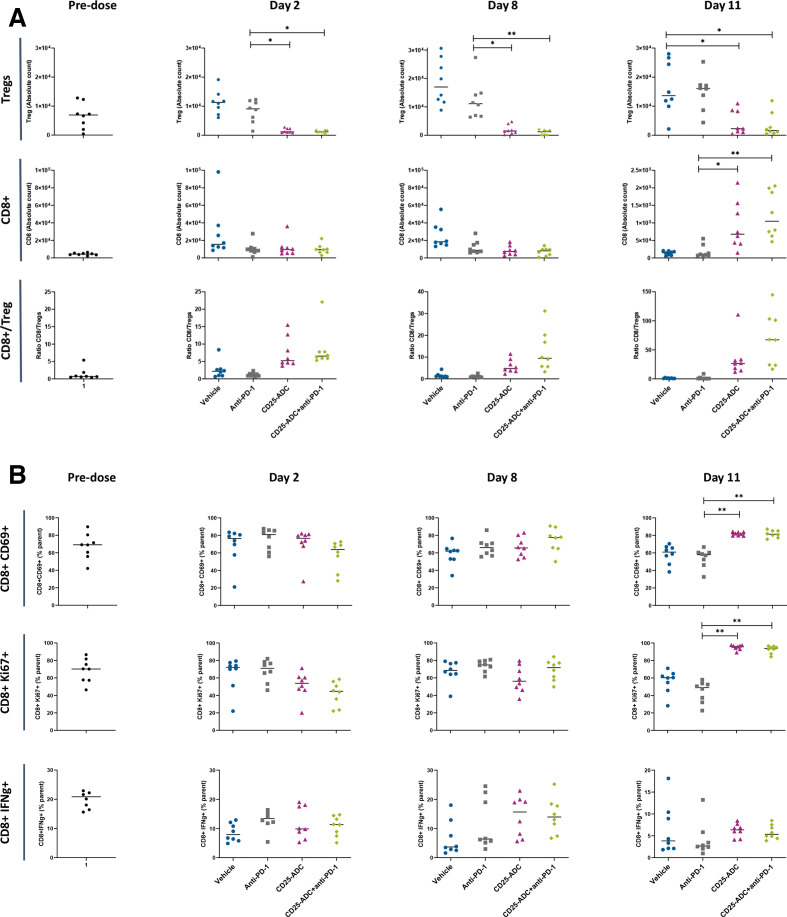
Figure 5.
Intratumoral T-cell immunophenotype analysis in MC38-bearing mice. (A) Absolute quantification of intratumoral Tregs, CD8+ T cells and CD8+/Treg ratio following i.p. treatment with anti-PD-1 antibody or CD25-ADC or the combination of CD25-ADC and anti-PD-1. (B) Percentage of CD69+, Ki67+ and IFNγ+ tumor-infiltrating CD8+ T cells. Tumors were processed at the indicated times (days post CD25-ADC dose). Horizontal bars represent median value. Statistical differences between treatment groups were calculated using JMP 15 by the Dunn method for joint ranking. Results were considered significant when p<0.05. *, p≤0.05; **, p≤0.01. IFN, interferon.

