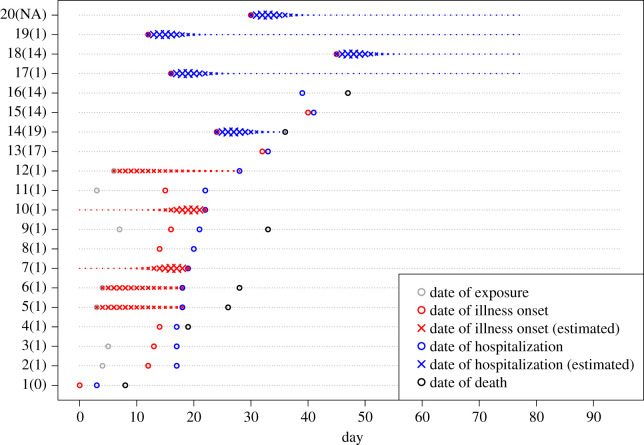
Figure 1.
The reconstructed timelines consisting of observed time events and the probability of reconstructed (missing) time events (n = 20 cases). The observed time events are denoted by open circles. The probabilities of reconstructed time events are measured by cross size. The grey, red, blue and black symbols denote the dates of exposure, onset of illness, hospitalization and death, respectively. The numbers shown on the y-axis represent case identity numbers (and associated infectors, where NA means that the infector is missing).

