Figure 2.
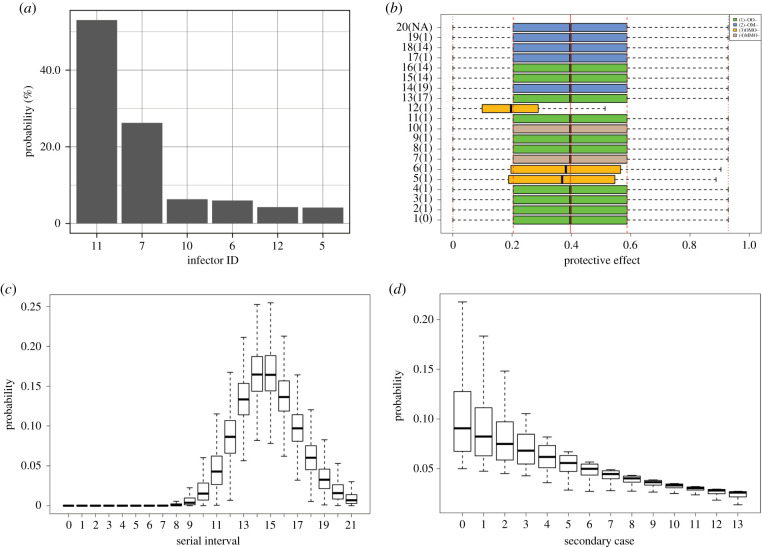
(a) The posterior distribution of the primary case of case 20. Case 11 was considered the most likely primary case with a probability of 53.1%, followed by case 7 with 26.3% and case 10 with 6.3%. (b) The posterior distribution of the individual protective effect of case isolation, εi, for each case. The green, yellow, blue and brown boxes show four observed patterns. O represents observed, M indicates missing and - indicates unused (i.e. observed or missing); the order of events follows the dates of exposure, onset of illness, hospitalization and death. The third pattern in yellow showed significantly lower individual protective effect than the other three patterns. The red solid, dashed and dotted lines show, respectively, the mean, interquartile range, and minimum and maximum of the protective effect of case isolation without delay, ε. (c) The posterior distribution of unbiased serial intervals s(τ) with mean at 15.3 (95% CI: 14.2–16.6) and s.d. at 2.3 (95% CI: 1.6–3.5) days. The unbiased distribution represents the situation in the absence of case isolation. The shape and scale parameters of the gamma distribution were estimated as 45.0 (95% CI: 19.6–92.0) and s.d. at 0.3 (95% CI: 0.2–0.8), respectively. (d) The posterior distribution of the secondary case number per primary case p(r), given the mean as the reproduction number at time zero, which was estimated to be 10.0 (95% CI: 3.0–18.5). The distributions shown in the figure were derived from the best-fit model that employs geometric and gamma distributions, respectively, to describe the distributions of the observed number of secondary cases per primary case and the unbiased serial interval. The posterior distributions are shown using black boxes, ranging from the lower to the upper quartiles along with the median.

