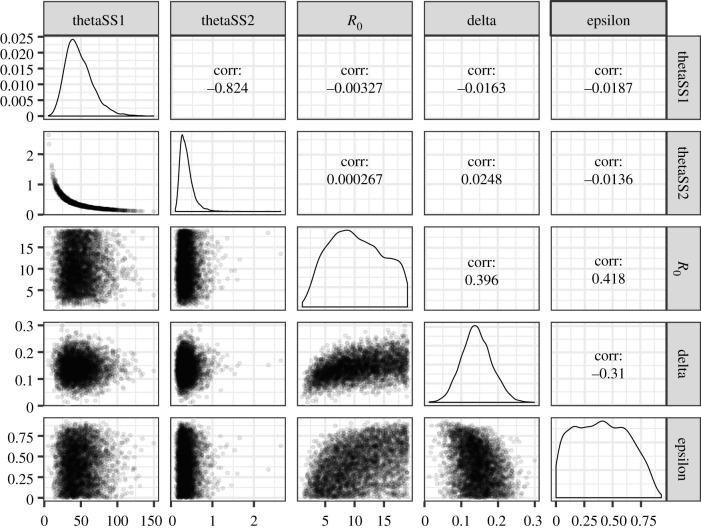
Figure 3.
The posterior distributions of parameters, derived from the best-fit model that employs geometric and gamma distributions, respectively, to describe the distributions of the observed number of secondary cases per primary case and the unbiased serial interval. The parameters include the shape (thetaSS1) and scale (thetaSS2) of the unbiased serial interval, the reproduction number at time zero (R0), the exponentially decreasing rate of secondary transmission (delta) and the protective effect of case isolation without time delay (epsilon). The diagonal plots show the marginal distributions. The lower diagonal reflects dependence between parameters by scatter plots. The upper diagonal indicates correlation between parameters.

