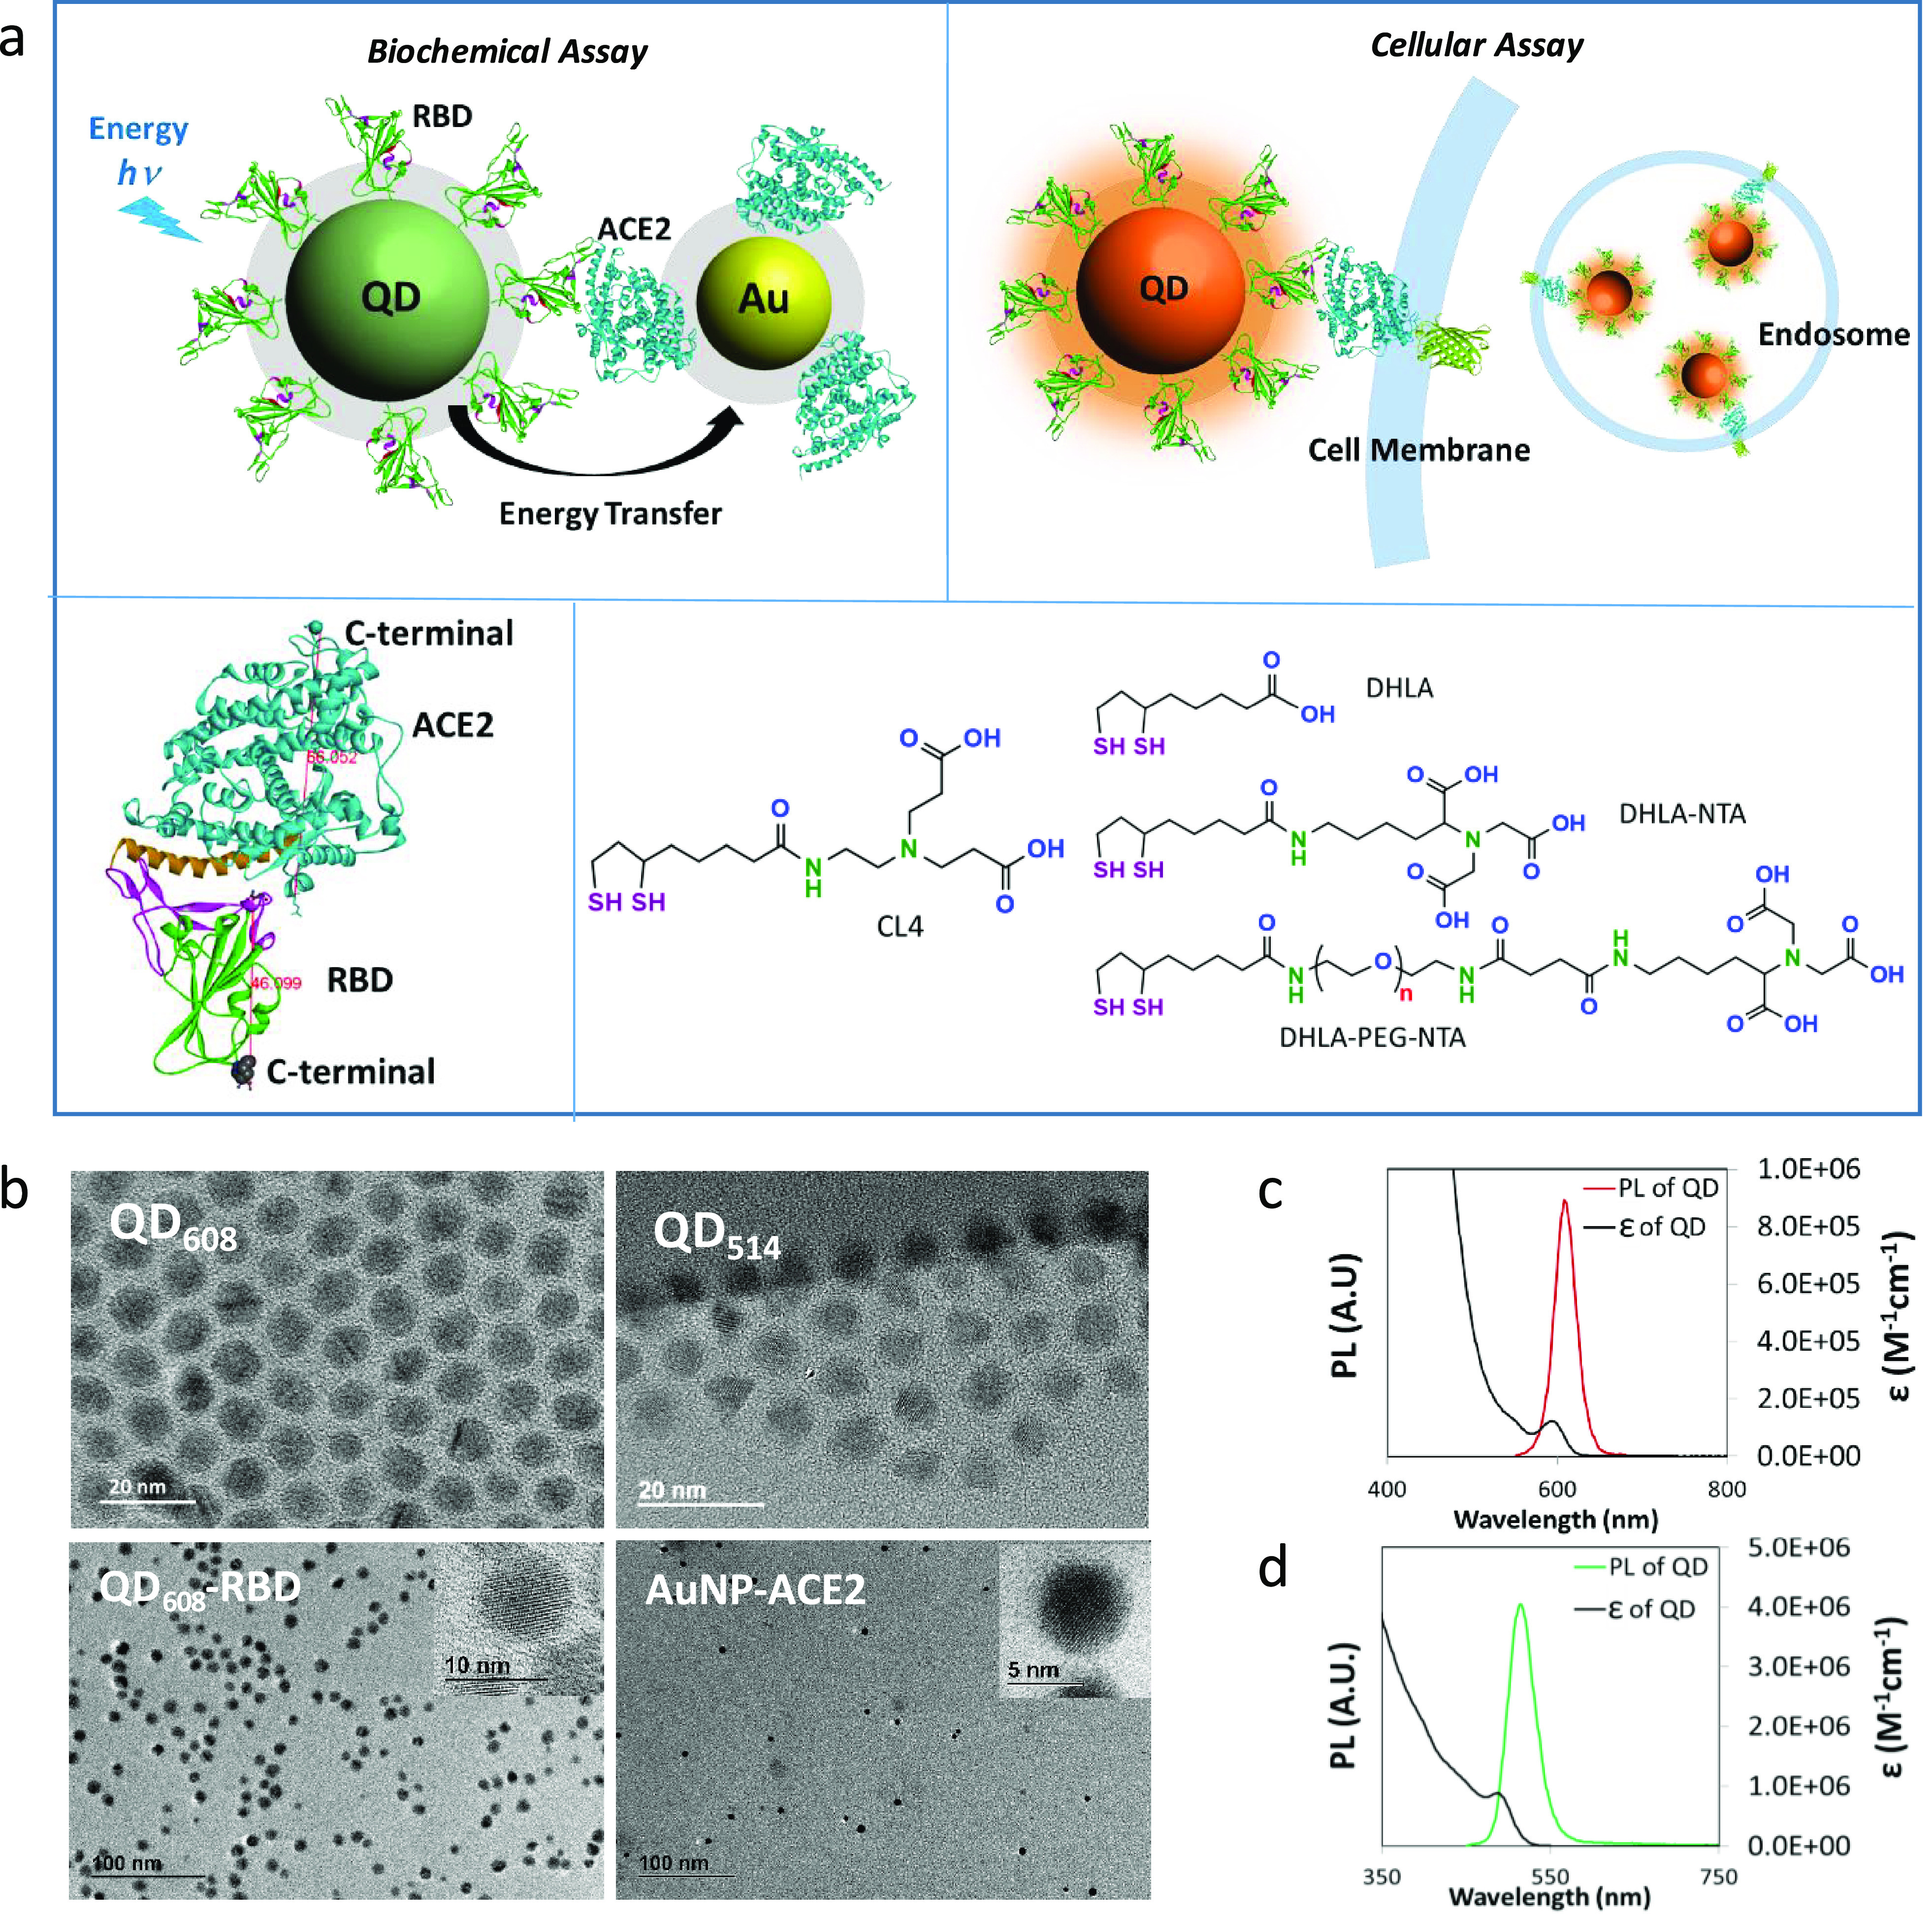
Figure 1.

Assay design and physical properties of nanoparticles. (a) Schematic diagram of the biochemical assay using energy transfer from QD-RBD to AuNP-ACE2 (top left) and the cellular assay using QD-RBD interaction with ACE2 (with or without GFP modification at the end of the C-terminal) on the cell membrane (top right). The bottom image shows the binding of ACE2 and RBD (bottom left, the estimated size measured in Å) and the chemical structure of surface ligands for both QDs (CL4) and AuNPs (DHLA ligands) (bottom right). (b) TEM images of NPs. Top: As-synthesized QD608 (10.1 ± 0.94 nm) and QD514 (8.4 ± 0.84 nm). Bottom: QD608-RBD (10.1 ± 0.89 nm) and AuNP-ACE2 (5.8 ± 0.8 nm). (c) Absorption and fluorescence spectra of CL4-coated QD608 in water. (d) Absorption and fluorescence spectra of CL4-coated QD514 in water.
