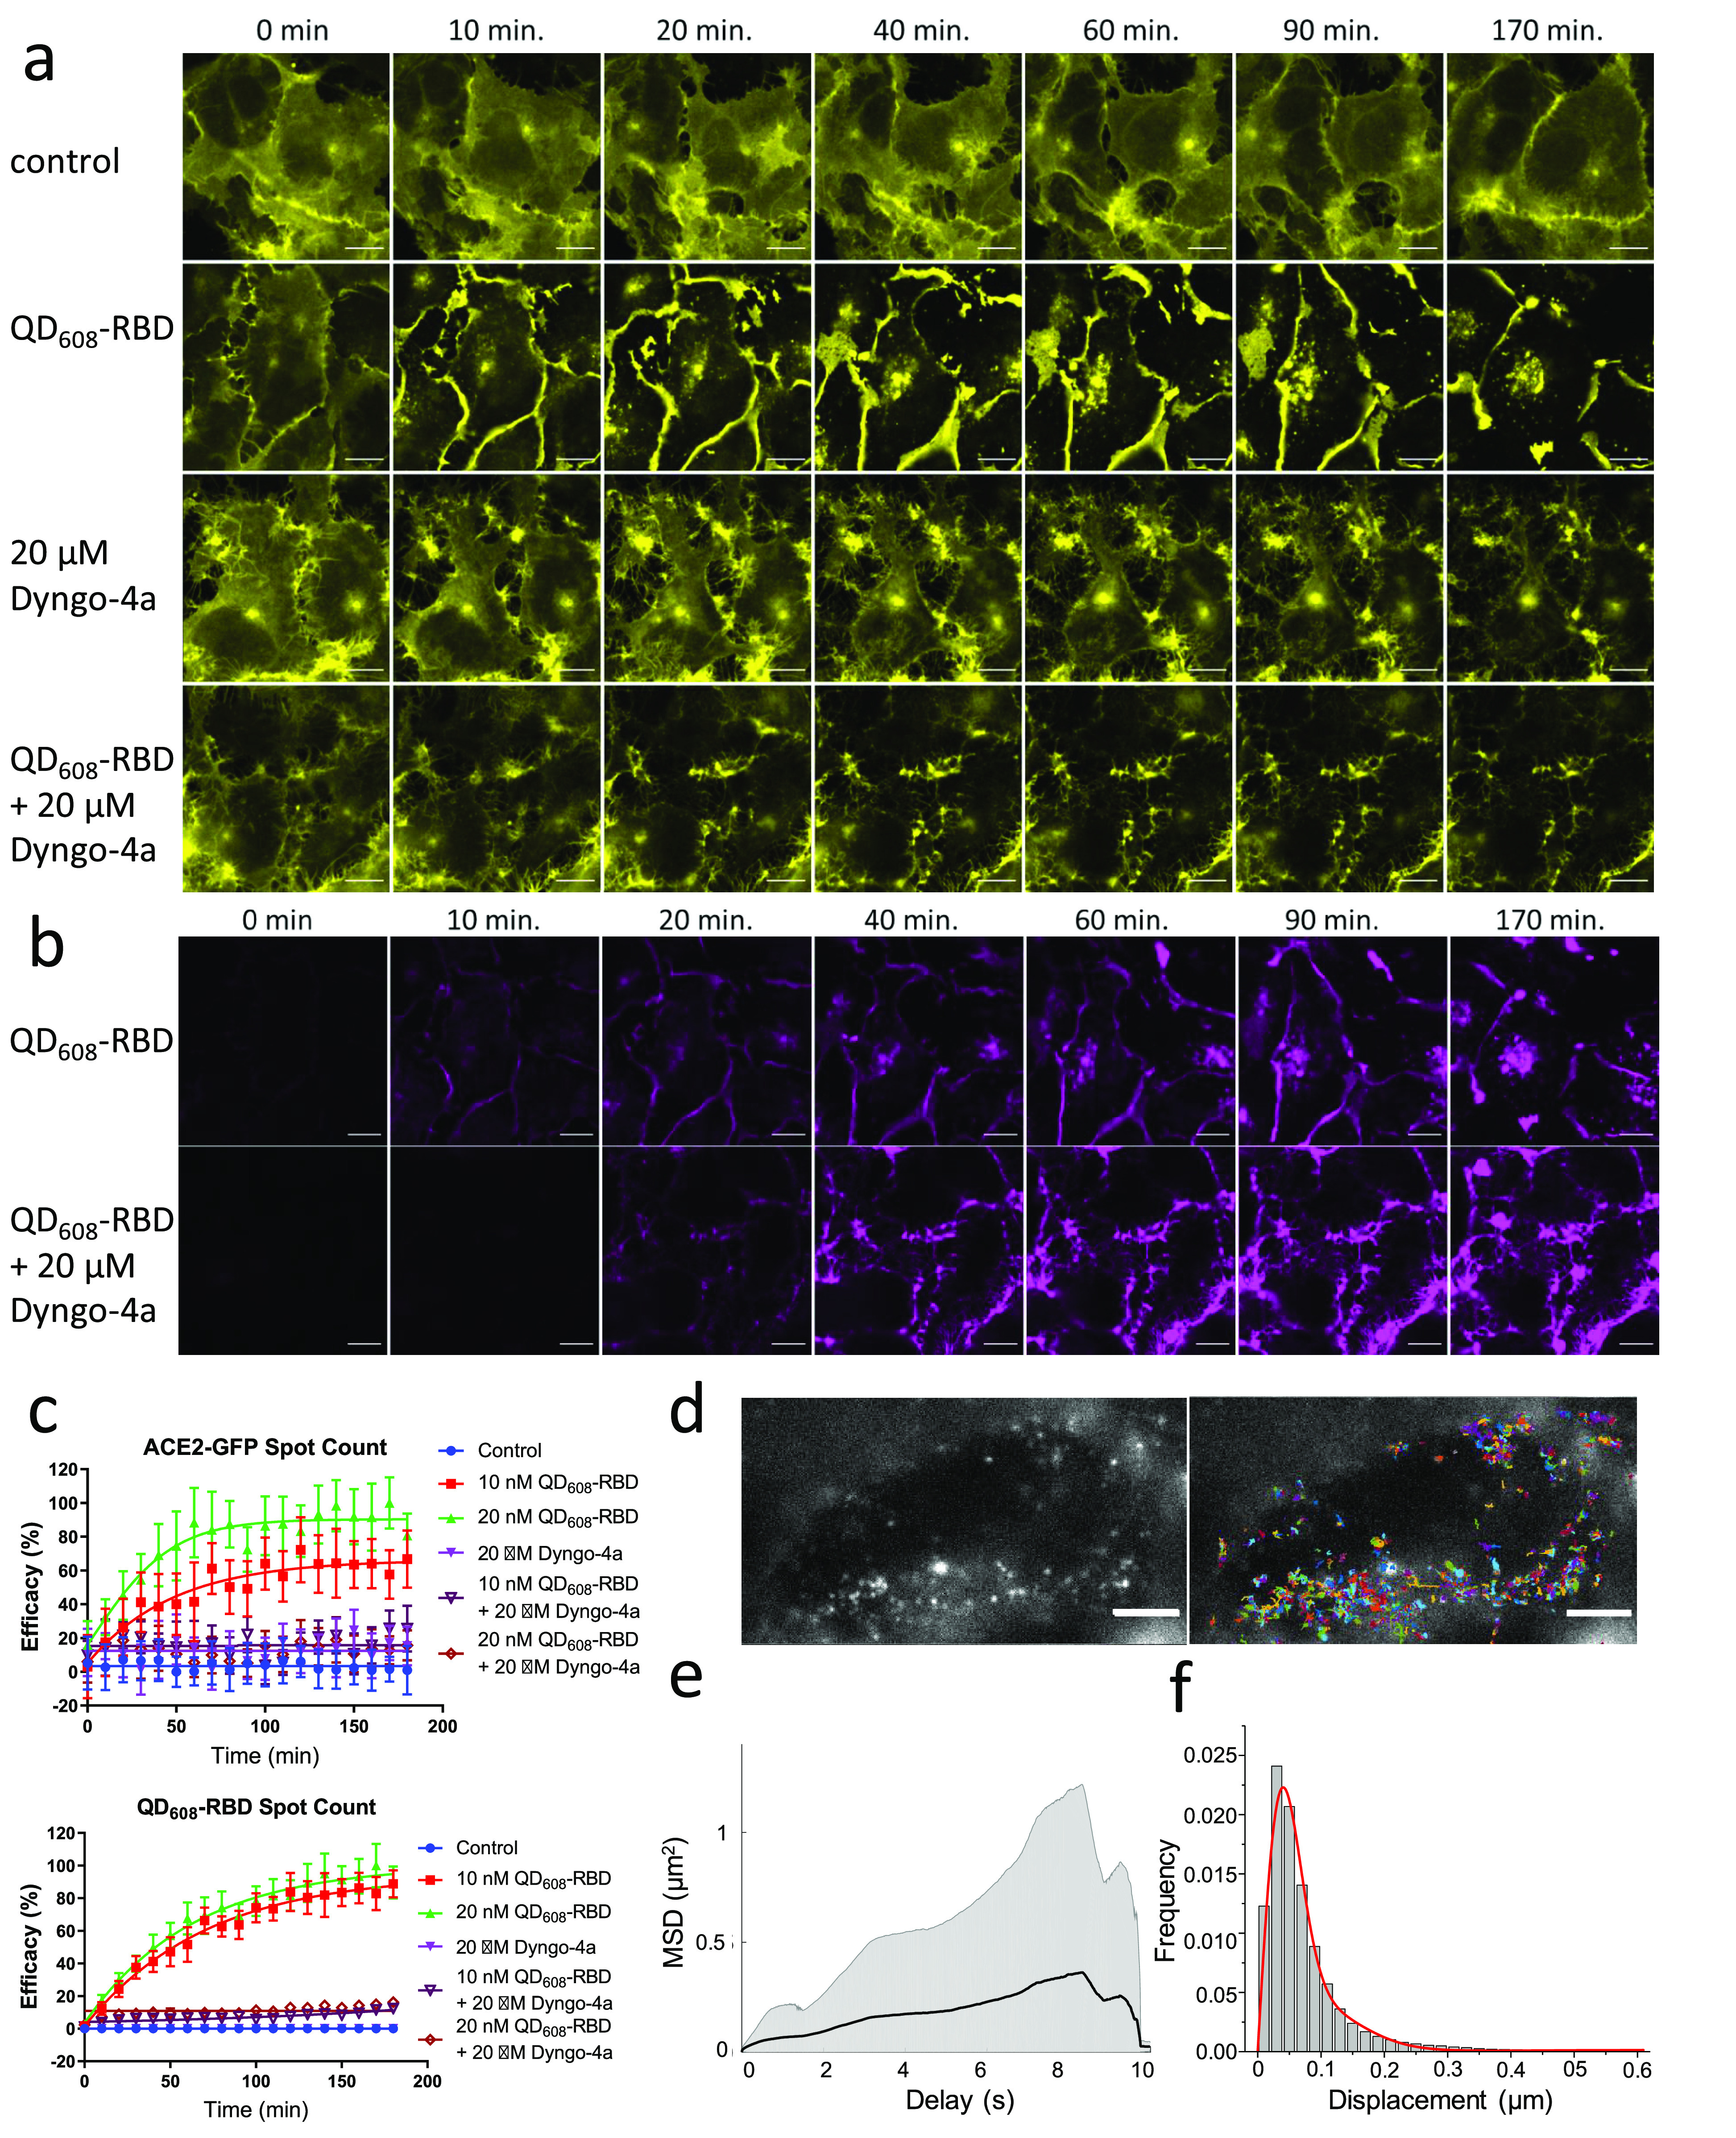
Figure 5.

QD608-RBD-induced translocation of ACE2-GFP is blocked using endocytosis inhibitor Dyngo-4a. (a) Representative image montage of ACE2-GFP signal (yellow) in HEK293T clone 2 treated with 10 nM QD608-RBD. ACE2-GFP is represented by a yellow look-up table. (b) Same cells from (a) showing the QD608-RBD signal (magenta). Control cells were incubated with Optimem I alone. Dyngo-4a-treated cells were first preincubated with compound for 15 min. Time course spans 3 h and imaging began immediately after treating cells with QD608-RBD. Images were captured using a 63× objective. Scale bar, 25 μm. (c) High-content analysis averages of spot count for ACE2-GFP and QD608-RBD. Curves were fit using nonlinear regression. N ≥ 1100 cells from 4 fields each from 10 wells per condition, representative of three experiments. Error bars indicate SD. (d) Single-particle imaging of QD (left) and overlay with tracks (right) in ACE2-GFP HEK293T cells. Scale bar, 5 μm. (e) The ensemble mean of all mean square displacements (MSD) (1562 tracks) is shown as a black solid line. The grayed area represents the weighted standard deviation over all MSD curves. (f) Distribution of one-step jump distances with fitted curve (red solid line) of QDs in the ACE2-GFP HEK293T cells.
