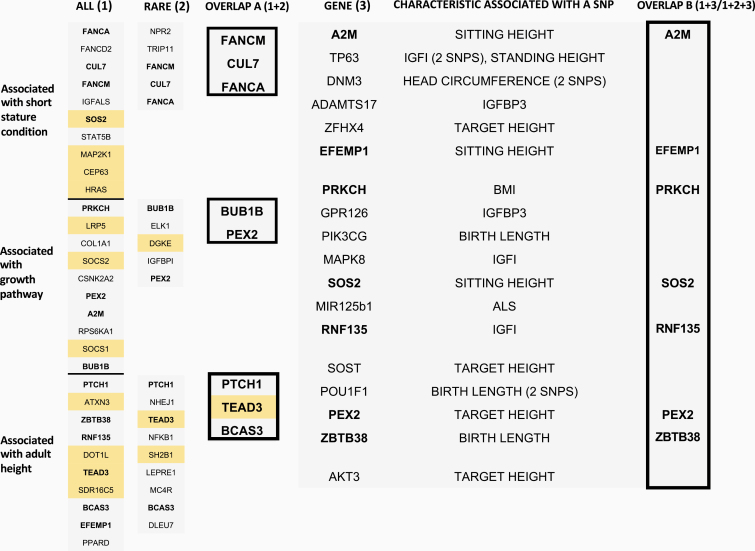
Figure 1.
Overlaps between both gene-wide analyses and with genes containing variants associated with growth characteristics/IGF status.
Results from both gene-based burden testing approaches are shown here, with overlap A illustrating genes that were identified by both methods. Orange boxes indicate genes where SNP frequency was greater in SS-UA cases and blue boxes represents genes where SNP frequency was lower in SS-UA cases compared with controls. Genes involved in an overlap are shown in bold. On the right, results of the PLINK analyses, linking specific variants to particular growth characteristics/biochemical measures of IGF status are shown. A P-value of ≤ 0.001 was considered significant. Overlap B highlights those genes that were identified by this method, as well as by one (all SNPs or rare SNPs alone) or both SNP burden testing approaches.

