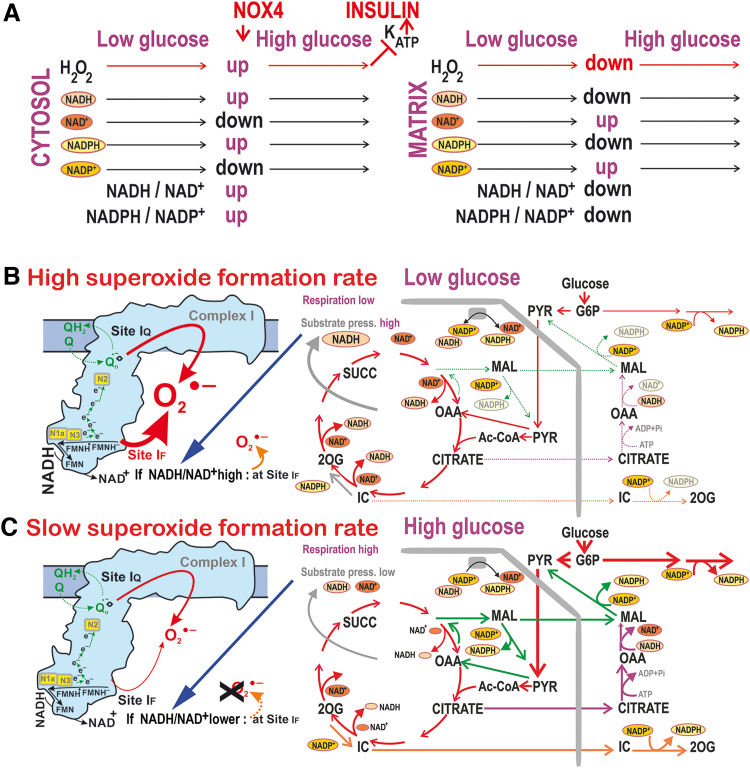
FIG. 10.
Major metabolic fluxes and redox shuttles contributing to diminished mitochondrial superoxide generation in pancreatic β cells on GSIS. (A) Overview of changes on GSIS in the cytosol and mitochondrial matrix; (B) Cells at low glucose; (C) cells on glucose intake: Higher rates of metabolic fluxes are depicted by thick arrows, whereas lower rates are shown by dotted arrows and decreasing products are depicted in gray fonts or symbols. The color coding for shuttles and abbreviations are the same as in Figure 1. Similarly, higher superoxide formation rate is indicated with thick arrows, whereas slow rate is depicted with thin arrows. Color images are available online.

