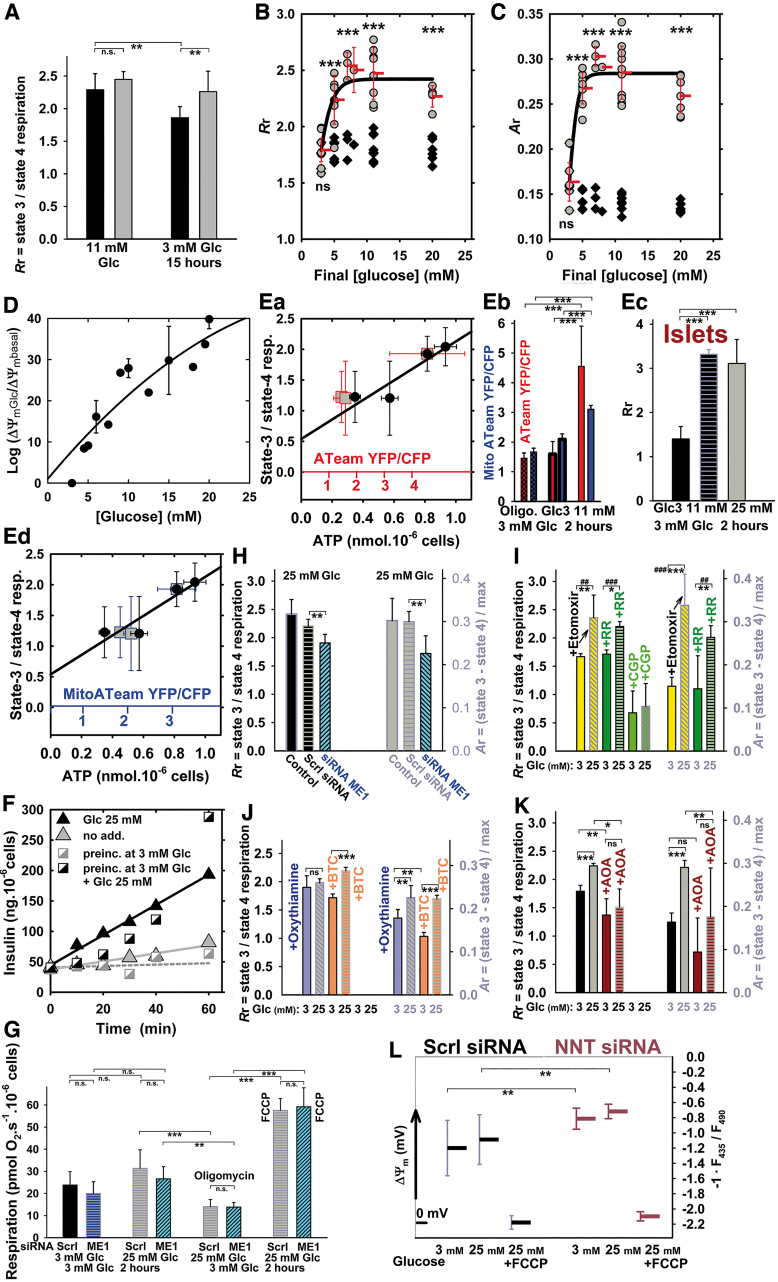
FIG. 2.
Respiration, bioenergetic profile, ΔΨm, ATP levels, and insulin secretion in INS-1E cells. (A) Phosphorylating to nonphophosporylating respiration ratio (Rr) before (black bars) and after (gray bars) glucose addition to reach 25 mM final concentration. INS-1E cells were cultured in 11 mM glucose (“11 mM”) or preincubated in cell culture medium with 3 mM glucose (“3 mM”) for 15 h. ANOVA (n = 13–15): **p < 0.05. (B, C) Glucose-dose dependence of phosphorylating/nonphosphorylating respiratory rate ratio Rr (B) and the parameter Ar (C). INS-1E cells were preincubated in KRHBSA containing 3 mM glucose for 1 h. Black symbols represent parameters calculated relatively to the respective respiration at 3 mM glucose, whereas gray symbols at 20 mM glucose. Endogenous, that is, phosphorylating respiration rates were always recorded before glucose additions to desired concentrations, and after these additions. This was followed by the addition of 1 μM oligomycin, but oligomycin was also added to KRHBSA with 3 mM glucose in parallel runs. In this way, parameter Rr was calculated for situations before (black symbols) and after glucose addition (gray symbols). FCCP was adjusted (titrated) for maximum response to estimate the maximum (uncoupled) respiration for each glucose concentration, and data were used to calculate the parameter Ar (phosphorylating minus nonphosphorylating respiration rate divided by the maximum respiration rate with FCCP). Student's t-test: ***p < 0.001. (D, L) Mitochondrial membrane potential (ΔΨm) estimated by using TMRE (D) and JC-1 (L). (D) ΔΨm is plotted against final glucose concentrations as ratios of TMRE fluorescence after (ΔΨmGlc) and before (ΔΨmbasal) glucose addition on a logarithmic scale; (L) JC-1-estimated ΔΨm is displayed in a diagram for 3 and 25 mM glucose in cells transfected with a scrambled (“Scrl”) siRNA or NNT siRNA. ANOVA (n = 8): **p < 0.02. (E) Correlations between ATP levels assayed using bioluminescence (black points) or cytosolic (Ea; red points; red x-axis) and mitochondrial matrix ATeam FRET-sensor (Ed; blue points; blue x-axis) and phosphorylating to nonphophosporylating respiration ratios Rr—INS-1E cells were preincubated at varying glucose in cell culture medium without pyruvate for 2 h and, subsequently, respiration and ATP levels were measured. Confidence for the correlations was 95%. (Eb) Ratios of YFP and CFP emission of the ATeam FRET sensors are plotted before and after transition from 3 to 20 mM glucose (same color coding as above). ANOVA (n = 33–47): ***p < 0.001. (Ec) Parameter Rr for respiration of PIs—assayed by using the Seahorse apparatus, in which irreproducible results are obtained with FCCP, hence Ar cannot be derived. (F) Time courses for insulin secretion. Secreted insulin levels are shown after glucose addition (25 mM final concentration) to INS-1E cells cultured in 11 mM glucose (black triangles) or preincubated in standard cell culture medium containing 3 mM glucose for 2 h (black squares). Gray symbols: time courses without glucose addition. In addition, cells were preincubated in KRH buffer for 5 min before the ELISA insulin assay in KRH. (G) Effect of ME1 silencing on endogenous respiration rates (n = 6) with 3 and 25 mM glucose and nonphosphorylating respiration (“oligomycin”; 1 μM oligomycin) and maximum respiration (“FCCP,” adjusted for maximum response) with 25 mM glucose; or (G–K) effects of ME1 silencing and metabolic or transport inhibitors (I–K) on respiratory parameters calculated as described earlier—Rr (left y-axis) and Ar (right y-axis). For the original respiration data and their replicates, see Supplementary Figures S1 and S2. Ruthenium red (7 μM), etomoxir (100 μM), 10 μM CGP37157, oxythiamine (40 μM), BTC (10 mM), and AOA (4 mM) were present as indicated. ANOVA (n = 4–6): *p < 0.1; **p < 0.05; ***p < 0.001; or Student's t-test for chosen pairs: ##p < 0.05; ###p < 0.001. ANOVA, analysis of variance; AOA, aminooxyacetic acid; BSA, bovine serum albumin; BTC, 1,2,3-benzene-tricarboxylate; FCCP, 4-(trifluoromethoxy)phenylhydrazone; KRH, Krebs-Ringer HEPES buffer; ME1, cytosolic malic enzyme; ns, nonsignificant; PI, pancreatic islet; siRNA, small interfering RNA; TMRE, tetramethylrhodamine ethyl ester. Color images are available online.

