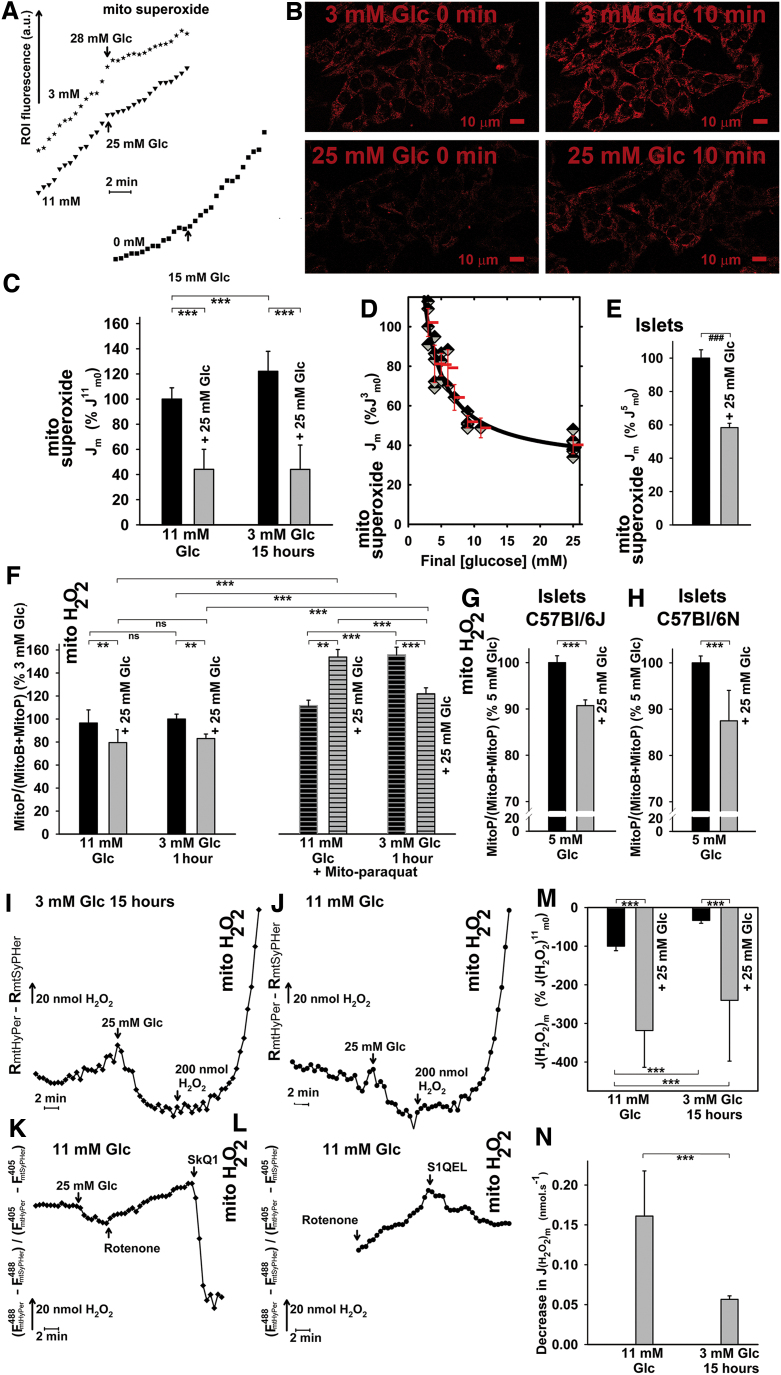
FIG. 3.
Release of superoxide and H2O2 into the mitochondrial matrix of INS-1E cells on GSIS. INS-1E cells (A–D) were assayed for surplus mitochondrial matrix superoxide release (over MnSOD consumption) by using confocal microscopy monitoring (B) of MitoSOX Red fluorescence (see also Supplementary Fig. S3G). PIs were assayed similarly (E) by using MitoSOX Red spectra scanning. Black columns: values before GSIS; gray columns: values after GSIS. (A) Representative traces—Jm rates were determined from the slopes of linearized traces, such as illustrated, of increasing MitoSOX Red integral fluorescence encompassing mitochondrial ROI, plotted versus time for each series of the corresponding confocal images (18, 28, 29). When indicated, INS-1E cells were cultured in 11 mM glucose, or preincubated in medium containing 3 mM glucose for 15 h. Alternatively, cells were preincubated in KRH medium containing bicarbonate “0 mM.” Final glucose levels after a glucose addition are indicated by arrows. (B) Representative confocal images for MitoSOX Red assay carried out separately for 3 and 25 mM glucose. (C) Quantification of mitochondrial superoxide production rates Jm for cells cultured in medium containing 11 mM glucose (“11 mM Glc”) or preincubated in cell culture medium containing 3 mM glucose (“3 mM Glc 15 h”). Jm rates were normalized to average Jm rates obtained in cells cultured in 11 mM glucose before GSIS (J11m0). ANOVA (n = 11; n = 6 for 3 mM 15 h): ***p < 0.001. (D) Decrease in mitochondrial matrix-released superoxide—dose response related to the final glucose concentration ([glucose]) performed by using MitoSOX Red confocal microscopy monitoring. The higher the final glucose concentration reached, the higher the decrease in Jm rates on glucose addition. (E) Isolated mouse PIs: Jm rates before (black column) and 15 min after glucose addition (gray column) were derived from changes in MitoSOX Red spectra after glucose addition to isolated mouse PIs (cf. Supplementary Fig. S3H). Student's t-test (n = 3): ###p < 0.001. (F–H) MitoP/(MitoB+MitoP) ratios reflecting matrix ROS accumulated after 2 h in INS-1E cells or PIs isolated from the indicated mouse strains. Ratios were normalized to values obtained for incubations in medium with 3 mM glucose. Mito-paraquat, 20 μM. ANOVA (n = 4): **p < 0.05; ***p < 0.001. (I–N) Mitochondrial matrix H2O2 release. JmH2O2 rates were assessed by mito-HyPer fluorescence confocal microscopy monitoring, whereas pH changes were accounted for by mito-SypHer. The differences in these records were taken as being proportional to the net mitochondrial matrix H2O2 release. (I–K) Representative differential time courses are illustrated for cells preincubated in 3 mM glucose (I) or cultured in medium with 11 mM glucose (J), and after the addition of 20 μM rotenone (K) or 1 μM S1QEL (L). Relative (M) and approximate absolute (N) quantifications of the resulting JmH2O2 rates are shown. ANOVA (n = 3–6): ***p < 0.001. MnSOD, manganese superoxide dismutase; ROI, regions of interests; ROS, reactive oxygen species; S1QEL, suppressor of complex 1 site Q electron leak. Color images are available online.

