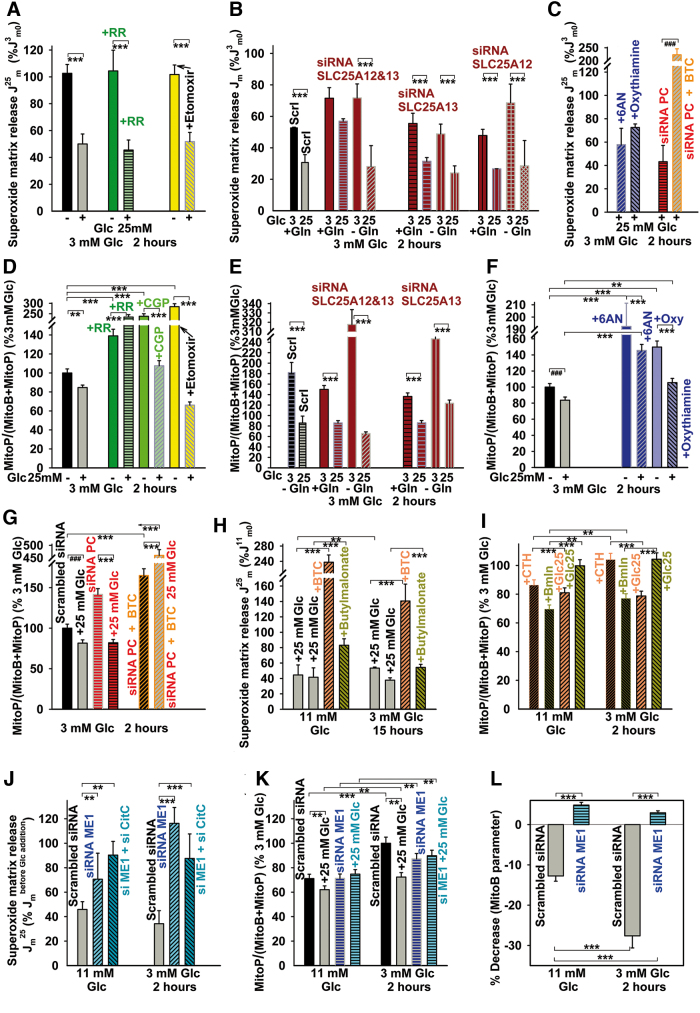
FIG. 4.
MitoSOX Red and MitoB responses in the presence of various inhibitors of carriers and metabolism, on silencing ME1, pyruvate carboxylase, or aspartate/glutamate carriers of the malate/aspartate shuttle. Mitochondrial matrix superoxide release rates Jm (A–C, H, J) and changes in 2 h-accumulation of H2O2/ROS (D–G, I, K, L) on transition between 3 and 25 mM glucose: (A, D) in the presence of RR (green) (7 μM), etomoxir (100 μM) (yellow bars), and CGP37157 (10 μM) (light green bar); (B, E) on blockage of components of the malate/aspartate shuttle (dark red bars), that is, silencing of aspartate/glutamate antiporters SLC25A12/AGC1/aralar and SLC25A13/AGC2. (C, F) PPP blockage using 1 mM 6AN or 40 μM oxythiamine (blue bars); (C, G) pyruvate carboxylase silencing (red/orange bars); for scrambled siRNA cf. (J, K); (H, I) assays with CitC (10 mM BTC; orange bars) and 2OGC inhibitor (5 mM n-butylmalonate; yellow-green bars); and (J–L) assays on silencing cytosolic malic enzyme (“siRNA ME1”) (dark blue or aquamarine bars) alone or together with CitC (“si ME1+ si CitC”) as compared with scrambled siRNA (gray bars). Jm rates obtained in the presence of 25 mM glucose (J25m) were normalized either to rates obtained in 11 mM glucose before GSIS (J11m0), rates obtained in 3 mM glucose before GSIS (J3m0), or their respective initial glucose concentration before glucose addition (Jmbefore Glc addition). ROS accumulation was normalized to 3 mM glucose. All preincubations in 3 mM glucose before the assay were performed for 2 h. ANOVA (n = 3–6): **p < 0.05; ***p < 0.001; Student's t-test: ###p < 0.001. 6AN, 6-aminonicotinamide; PPP, pentose-phosphate pathway; RR, ruthenium red. Color images are available online.

